Band 4.0 IELTS Writing Task 1 Model Answer
Overall Band Score: 4.0 · Cambridge IELTS 18 · 2026-11-05
IELTS Writing Task 1 question
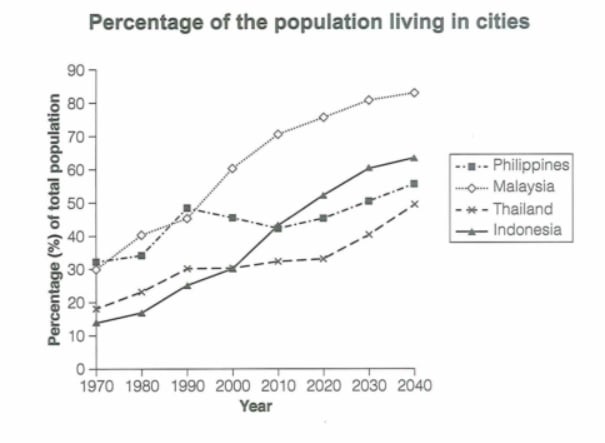
The graph below gives information about the percentage of the population in four Asian countries living in cities from 1970 to 2020, with predictions for 2030 and 2040. Summarize the information by selecting and reporting the main features and make comparisons where relevant.
Student answer (Band 4.0)
the line graph illuestrates the data the proportion in four asian countries living between 1970 and 2020, with predictions for 2030 and 2040. Ovarall , it is clear that the percentage of total population malaysia is higest trend additionaly thailand is lowest trend
AI examiner evaluation
| Criterion | Band |
|---|---|
| Task Achievement / Task Response | 3.0 |
| Coherence and Cohesion | 3.5 |
| Lexical Resource | 4.5 |
| Grammatical Range and Accuracy | 4.5 |
| Overall | 4.0 |
Task Achievement / Task Response: Band 3.0
You identify the chart’s subject and time span, and your overview attempts to compare the countries by saying Malaysia has the highest trend and Thailand the lowest. However, the response does not report the main changes or support this comparison with figures. It also overlooks important features: Indonesia rises sharply and is projected to become the second-highest, while the Philippines fluctuates before increasing. Thailand is the lowest only at the beginning; by 2040 the Philippines is higher than Thailand. The required minimum of 150 words is not met, so the task is addressed only minimally. To improve, write a clear overview and select key figures to describe the main trends and comparisons.
Coherence and Cohesion: Band 3.5
The response has a basic sequence: it introduces the graph and then gives an overall statement, with “Overall” signalling a shift to the summary. This provides a small amount of organisation, but the ideas are compressed into one short paragraph and there is no progression into supporting details. The comparison in the overview is also too broad to guide the reader through the data. Develop separate paragraphs for the overview and the main trends, and use clear links such as “By contrast” or “Meanwhile” to compare countries. This would create a more coherent account rather than leaving the reader with two unsupported statements.
Lexical Resource: Band 4.5
You use some relevant task vocabulary, including “line graph,” “proportion,” “percentage,” and “predictions,” so the topic is recognisable. However, the range is very limited, and several spelling and word-choice errors reduce clarity: “illuestrates,” “Ovarall,” and “higest” are inaccurate, while “highest trend” and “lowest trend” are not natural ways to describe the proportions. Prefer precise expressions such as “the highest proportion” or “the lowest figure,” and use verbs such as “rose,” “fell,” and “fluctuated” to report changes. A wider set of accurate trend vocabulary would help you describe the graph more clearly.
Grammatical Range and Accuracy: Band 4.5
The response shows an attempt to use a complex sentence in the opening, with the time period and forecast information added after a comma. However, the sentence is incomplete in meaning: “the proportion in four Asian countries living between 1970 and 2020” does not clearly state what the graph measures. The overview also has problems with articles and sentence structure: “the percentage of total population Malaysia is highest trend” needs a clearer grammatical relationship, such as “Malaysia has the highest proportion of its population living in cities.” The writing relies on two short sentences and shows little variety. Practise complete subject–verb structures and accurate comparative sentences.
See this exact question answered at other band scores. The same prompt compared across bands.
Browse more IELTS Writing model answers or get your own writing scored by the same AI examiner.