Band 6.0 IELTS Writing Task 1 Model Answer
Overall Band Score: 6.0 · Cambridge IELTS 18 · 2026-11-06
IELTS Writing Task 1 question
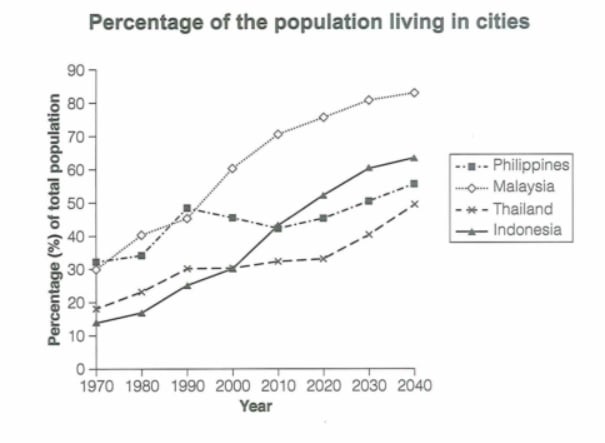
The graph below gives information about the percentage of the population in four Asian countries living in cities from 1970 to 2020, with predictions for 2030 and 2040. Summarize the information by selecting and reporting the main features and make comparisons where relevant.
Student answer (Band 6.0)
This graph illustrates the the percentage of population in four different Asian countries based in different cities from the year 1970 till 2020 alongside with the predictions for coming years, 2030 and 2040.
Overall it can be seen that Indonesia had the least amount of population in 1970 where as Philippines had the highest, among four of them the population started to rise as in future it is predicted that Malaysia will have the highest and second highest maybe Indonesia.
In 1970 Malaysia and Philippines had a similar proportion at almost 30% which by the time started to increase as it can be seen in 1980 Malaysia rose about 40% where as Philippines population had minor increase of about 3% moreover in 1990 Philippines percentage increased to approximately to 50% and edged Malaysia which was 45% furthermore till 2020 Malaysia had a major increase taking it up to 75% however Philippines experienced a decline till 2010 bu after it also started to rise. It is then predicted that Malaysia's percentage will surge to 80% where as Philippines till 60%.
On the other hand Thailand and Indonesia both had a lower percentage in 1970 and by the time it started to increase in 1990 Thailand was at 30% and Indonesia with a minimal increase at 15%. In the coming years Indonesia's population saw an increase till 2020 taking its percentage of population to 50% whereas Thailand's percentage remained constant through the years till 2020 at about 30%. Furthermore in future it is predicted that Thailand population will rise till 50% in 2030 and 2040 and Indonesia being the second highest at 60%
AI examiner evaluation
| Criterion | Band |
|---|---|
| Task Achievement / Task Response | 6.0 |
| Coherence and Cohesion | 6.5 |
| Lexical Resource | 6.0 |
| Grammatical Range and Accuracy | 5.5 |
| Overall | 6.0 |
Task Achievement / Task Response: Band 6.0
You identify the overall rise in urban populations and make relevant comparisons, including Malaysia’s strong growth and the Philippines’ temporary decline. The overview also notes the shift from the Philippines being highest initially to Malaysia leading in the forecasts. However, some key details are inaccurate or unclear: the Philippines, not Malaysia, is highest in 1970 (32% versus 30%), and Indonesia is already above Thailand by 2010 and remains ahead thereafter. The forecast says Thailand reaches about 50% by 2040, not in both 2030 and 2040; Indonesia is projected to reach about 64%, rather than simply being second highest at 60%. The overview’s “second highest maybe Indonesia” is also tentative. More precise reporting of these comparisons would make the summary more complete and reliable.
Coherence and Cohesion: Band 6.5
The response has a clear overall arrangement: an introduction, an overview, and separate paragraphs comparing the Philippines and Malaysia with Thailand and Indonesia. This gives the reader a generally logical route through the data. You also use linking expressions such as “Overall,” “On the other hand,” and “Furthermore.” However, several long sentences contain many comparisons joined by “whereas,” “moreover,” and “furthermore,” making the progression feel mechanical and occasionally difficult to follow. For example, the paragraph beginning “In 1970 Malaysia and Philippines…” moves through several years in one sentence. Some references are also unclear, such as “among four of them the population started to rise.” Use shorter sentences, group trends by country or period, and make each comparison explicit to strengthen the already coherent organisation.
Lexical Resource: Band 6.0
You use an adequate range of vocabulary for describing trends, including “edged,” “decline,” “surge,” and “remained constant.” These choices help communicate changes over time, and the meaning is generally clear. There are, however, some inaccurate or unnatural word combinations: “the least amount of population” is less suitable than “the lowest proportion,” and “population based in different cities” does not accurately express the share living in urban areas. “Till” is repeated where “by” or “until” would be more natural, and “minimal increase” does not describe Indonesia’s substantial rise to 25% by 1990. Aim for precise terms such as “urban population,” “proportion,” and “rose steadily,” and avoid using “population” when you mean a percentage.
Grammatical Range and Accuracy: Band 5.5
You attempt both simple and complex sentence forms, including clauses with “whereas” and time expressions such as “by the time,” so there is some structural variety. The main trends remain understandable, but some grammatical errors recur. The opening has a duplicated article in “the the percentage,” while “among four of them the population started to rise” has an unclear subject and awkward clause structure. There are also errors in articles and agreement, for example “Malaysia and Philippines” and “Thailand population,” and the phrase “Philippines till 60%” lacks a complete grammatical construction. Punctuation is also weak in several lengthy sentences, particularly where multiple clauses are joined. Check articles and possessives, and divide complex comparisons into complete, well-punctuated sentences.
See this exact question answered at other band scores. The same prompt compared across bands.
Browse more IELTS Writing model answers or get your own writing scored by the same AI examiner.