Band 5.0 IELTS Writing Task 1 Model Answer
Overall Band Score: 5.0 · Cambridge IELTS 18 · 2026-11-06
IELTS Writing Task 1 question
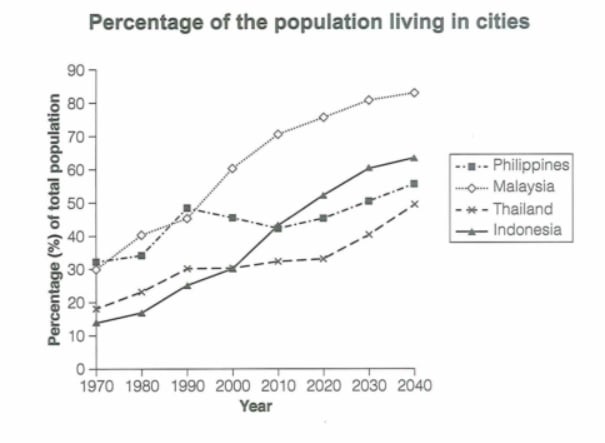
The graph below gives information about the percentage of the population in four Asian countries living in cities from 1970 to 2020, with predictions for 2030 and 2040. Summarize the information by selecting and reporting the main features and make comparisons where relevant.
Student answer (Band 5.0)
The graph compares the changes in the urban proportion of the population in four Asian countries, Philippines, Malaysia, Thailand and Indonesia from 1970 to 2020. and also give projections fro 2030 and 204.
Overall, it is clear that All countries urban population showed an upward trend. While Malaysia will dominated in the future by highest population rate in cities and Thailand experienced least percentages.
The percentage of urban population in Malaysia was highest. In 1970 the percentage was 30%.. then teh figure increased sharply to about 45% in 1990. After that it grew gradually and peaked at 80% approximately. The urban population of Indonesia showed an notable inrease throughout the period. The figure stood at about 10% in 1970. then the percentage climbed to 60% in 2040.
The percentage of population fluctuated firstly. it increased from nearly 30% in 1970 to 48% in 1990. and projected to grown to about 50% in 2040.Thailand showed a gradual growth and p
AI examiner evaluation
| Criterion | Band |
|---|---|
| Task Achievement / Task Response | 5.0 |
| Coherence and Cohesion | 4.5 |
| Lexical Resource | 5.5 |
| Grammatical Range and Accuracy | 5.0 |
| Overall | 5.0 |
Task Achievement / Task Response: Band 5.0
You identify the general upward movement and note Malaysia’s strong urbanisation, while also attempting to describe Indonesia and the Philippines. However, the task is only partly covered: the overview incorrectly says Thailand had the lowest percentages, although Indonesia was lower until the later years, and the response does not clearly compare all four countries. Some figures are inaccurate or too vague: Malaysia reaches about 83.5% in 2040, not merely “peaked at 80%,” and Indonesia is already around 52% in 2020 before reaching about 64% in 2040. The final discussion of Thailand is cut off, leaving its trend and comparisons undeveloped. Select the main turning points and give a complete overview supported by accurate comparisons.
Coherence and Cohesion: Band 4.5
There is a basic paragraph structure, with an introduction, an overview and separate attempts to describe the data. However, progression is difficult to follow because the country being discussed is not always identified: “The percentage of population fluctuated firstly” appears to refer to the Philippines, but this is unclear. Linking is also mechanical or faulty, as in “then” and “and” beginning fragments, and the final sentence stops at “Thailand showed a gradual growth and p”. This incomplete ending disrupts the organisation and leaves the report without a clear conclusion to its data description. Use one paragraph per logical group or country, name each series explicitly, and connect sentences with accurate transitions rather than fragments.
Lexical Resource: Band 5.5
You use some relevant task vocabulary, including “urban proportion,” “projections,” “upward trend,” “increased sharply” and “gradual growth.” This gives you enough language to communicate the broad topic, but the range is limited and several choices are inaccurate or awkward, such as “urban population rate in cities,” “showed an notable increase,” and “peaked” for a figure that continues to rise. Spelling errors—including “fro,” “teh,” “inrease” and “grown”—also make the writing less controlled. Aim for precise terms such as “the proportion living in urban areas” and “rose steadily,” and proofread carefully so errors do not distract from the comparisons.
Grammatical Range and Accuracy: Band 5.0
You attempt both simple and more complex forms, including the contrast in “While Malaysia will dominated…” and the time sequence “After that it grew gradually.” However, errors are frequent and sometimes make relationships between ideas difficult to understand. Examples include the faulty opening sentence, “from 1970 to 2020. and also give projections,” the incorrect future form “will dominated,” and the fragment “then the percentage climbed to 60% in 2040.” Tense and sentence boundaries are inconsistent, and the final clause is incomplete. Practise forming complete sentences with a clear subject and verb, use past tense for historical data and “is projected to” for forecasts, and check capitalisation and punctuation when joining clauses.
See this exact question answered at other band scores. The same prompt compared across bands.
Browse more IELTS Writing model answers or get your own writing scored by the same AI examiner.