Band 5.5 IELTS Writing Task 1 Model Answer
Overall Band Score: 5.5 · Cambridge IELTS 18 · 2026-11-06
IELTS Writing Task 1 question
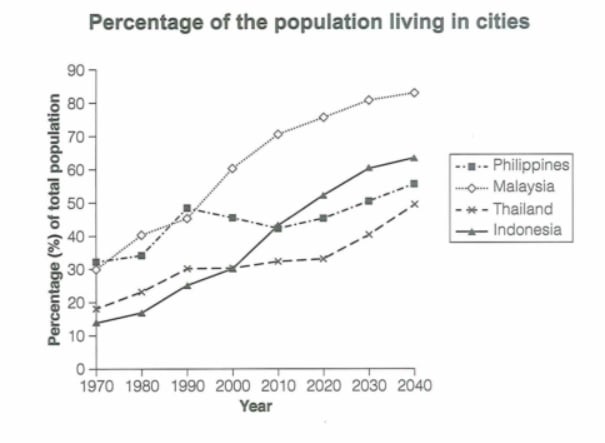
The graph below gives information about the percentage of the population in four Asian countries living in cities from 1970 to 2020, with predictions for 2030 and 2040. Summarize the information by selecting and reporting the main features and make comparisons where relevant.
Student answer (Band 5.5)
The line graph illustrates that the percentage of the population in four countries living in 1970 to 2020 and also provide the predictions for 2030 to 2040.
Overall, the graph shows the percentage of population in four different countries like as, Philippines , Malaysia , Thailand and Indonesia living in cities from 1970 to 2020 i also increase in every 10 years. Moreover, also predict the population rate from 2030 to 2040 which is also increase all these countries.
Firstly, in philippines population is 32% in 1970 and in 1980 it also increase sharply upto 48% in 1980 after this is gradually slow down in next 20 years in 2010 population rate is 42% then it again rise up slowly in every 10 years and in 2040 the population rate will be a 55%. In Malaysia population rate grow slowly in 1970 to 1990 after this it increase sharply and will be in 2040 it will predict the population rate is approximately 80%.
On the other hand, thailand and indonesia also increase the population rate in every 10 years. Moreover, in 1970 its population rate is 12 to 18 % approximately. It increase slowly and after 2000 Indonesia population rate increase sharply and tends towards a 60% in 2040. Thailand population increase slowly it will be a 45% in 2040.
AI examiner evaluation
| Criterion | Band |
|---|---|
| Task Achievement / Task Response | 5.5 |
| Coherence and Cohesion | 5.5 |
| Lexical Resource | 5.0 |
| Grammatical Range and Accuracy | 5.0 |
| Overall | 5.5 |
Task Achievement / Task Response: Band 5.5
You identify the four countries and include an overview that urbanisation generally rises, with further increases predicted. You also report some useful figures, such as the Philippines reaching about 55% and Malaysia about 80% by 2040. However, the overview is too general and does not highlight the key contrasts: Malaysia becomes the most urbanised, while Indonesia shows the strongest sustained rise and overtakes the Philippines around 2010. Some details are inaccurate or unclear: the Philippines rises to about 48% in 1990, not 1980, and its trend is not simply increasing every decade. Thailand is projected to reach about 50%, rather than 45%, in 2040. Select the main turning points and compare the countries more explicitly.
Coherence and Cohesion: Band 5.5
The response has a basic structure, moving from an introduction and overview to country details, and the grouping of the Philippines and Malaysia before Thailand and Indonesia gives the reader some direction. However, progression within paragraphs is uneven: the Philippines figures are difficult to follow because the years and changes are not consistently linked, while the Malaysia discussion is brief and lacks a clear comparison. Connectors such as “Moreover” are repeated and sometimes do not show a meaningful relationship between ideas. Use one paragraph for the overview and organise the details into clear comparisons, for example, contrasting Malaysia’s high endpoint with Indonesia’s rapid growth. Clearer referencing and more precise links between dates would make the account easier to follow.
Lexical Resource: Band 5.0
You use some relevant trend vocabulary, including “increase sharply,” “gradually slow down,” and “rise up slowly,” so the reader can understand the broad direction of change. However, the range is limited and several phrases are repetitive or imprecise, particularly repeated uses of “population rate” and “increase.” Some expressions are awkward for describing this graph, such as “tends towards a 60%” and “it will be a 45%.” Country names also need consistent capitalisation. Aim for more precise terms for urbanisation and data movement, and vary your language while keeping collocations natural. This would make comparisons clearer and reduce the effort required to interpret some sentences.
Grammatical Range and Accuracy: Band 5.0
The response attempts both simple and longer sentences, but complex constructions are often faulty and errors occur frequently enough to make some details harder to interpret. For example, the opening sentence lacks a clear grammatical structure (“the percentage of the population in four countries living in 1970 to 2020”), and “it also increase” has incorrect subject–verb agreement and tense. The sentence about Malaysia (“will be in 2040 it will predict…”) also combines clauses without a workable structure. Articles and prepositions are sometimes missing or misplaced, as in “in 2040 the population rate will be a 55%.” Use shorter, controlled sentences first, then practise accurate past-tense descriptions and clear future forms for predictions.
See this exact question answered at other band scores. The same prompt compared across bands.
Browse more IELTS Writing model answers or get your own writing scored by the same AI examiner.