Band 5.0 IELTS Writing Task 1 Model Answer
Overall Band Score: 5.0 · Cambridge IELTS 18 · 2026-11-08
IELTS Writing Task 1 question
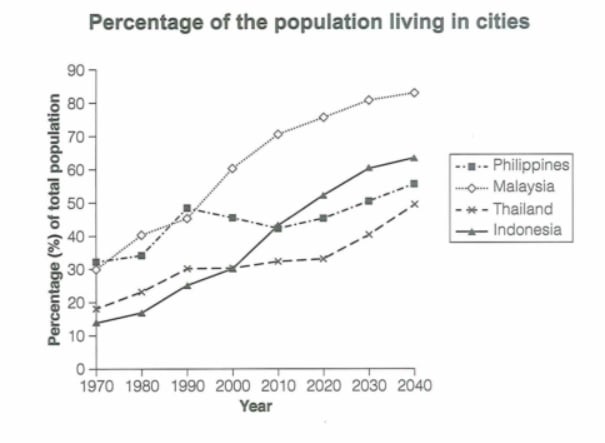
The graph below gives information about the percentage of the population in four Asian countries living in cities from 1970 to 2020, with predictions for 2030 and 2040. Summarize the information by selecting and reporting the main features and make comparisons where relevant.
Student answer (Band 5.0)
The line graph shows the percentage of people who lives in cities ih four counties in Asia from 1970 to 2040.
Overall, it is clear that the population all the countries increase to be more than what it had in 1970. malaysia and Philippiens had a high percentage then the others, Indonesia had the lowes share in the same year.
In 1980, malaysia and Philippiens both rose from 30 and 31 to 40 and 32 percentage point, malaysia proportion rose sharply to be the highest in 1980.by 1990, thome both keep rose to be around 45% for malaysia and 48% for Phillipen. it is clear that the population in Philippiens keep rose to became more than 70 in 2020 and it will be the highest in 2040 at around 80%
AI examiner evaluation
| Criterion | Band |
|---|---|
| Task Achievement / Task Response | 4.0 |
| Coherence and Cohesion | 5.0 |
| Lexical Resource | 5.0 |
| Grammatical Range and Accuracy | 5.0 |
| Overall | 5.0 |
Task Achievement / Task Response: Band 4.0
You identify the topic and make a basic overall comparison, noting that all four countries rise from 1970 and that Indonesia starts lowest. However, the response covers only a small part of the graph and does not give a balanced account of the main trends. Several key details are inaccurate: the Philippines does not exceed 70% in 2020 or become the highest in 2040; it is about 45.5% and 55.5%, while Malaysia is highest at about 76% and 83.5%. The account also omits Indonesia’s strong rise and Thailand’s slower growth. The response is 20 words below the required minimum, which further limits its coverage. Select the main trends accurately and support the overview with relevant figures.
Coherence and Cohesion: Band 5.0
There is a basic structure, with an opening, an overview and a paragraph describing some figures. The sequence from 1980 to 1990 gives the reader a starting point, and phrases such as “Overall” and “by 1990” signal stages. However, the response does not progress through the full time period or organise the four countries into clear comparisons. The final sentence combines several claims without a clear link, and the paragraph ends abruptly. Some connections are also difficult to follow, particularly “thome both keep rose.” Use separate, logically ordered sentences to compare the countries, and cover the historical period before the predictions.
Lexical Resource: Band 5.0
The response uses some relevant graph vocabulary, including “percentage,” “proportion,” “sharply,” and “highest,” so the topic is generally recognisable. However, the range is limited and several spelling and word-choice errors make parts difficult to understand, such as “counties,” “Philippiens,” “thome,” and “lowes.” Phrases such as “population all the countries increase” and “keep rose” are not natural ways to describe trends. Aim for accurate, consistent terms such as “urban population,” “share,” “increased,” and “declined,” and check spelling carefully. More precise trend language would also help distinguish steady growth from sharper changes.
Grammatical Range and Accuracy: Band 5.0
You attempt both simple and longer sentences, including an overview beginning “Overall” and a time sequence introduced by “In 1980” and “by 1990.” However, the range remains limited, and frequent errors affect clarity. For example, “people who lives” has incorrect subject–verb agreement, while “the population all the countries increase” lacks a clear grammatical structure and uses the wrong verb form. Tense and sentence boundaries are also inconsistent, as in “it will be the highest in 2040 at around 80%.” Practise forming accurate past-tense comparisons and future predictions, and use full stops to separate claims. These corrections will make your trend descriptions easier to follow.
See this exact question answered at other band scores. The same prompt compared across bands.
Browse more IELTS Writing model answers or get your own writing scored by the same AI examiner.