Band 6.0 IELTS Writing Task 1 Model Answer
Overall Band Score: 6.0 · Cambridge IELTS 18 · 2026-11-08
IELTS Writing Task 1 question
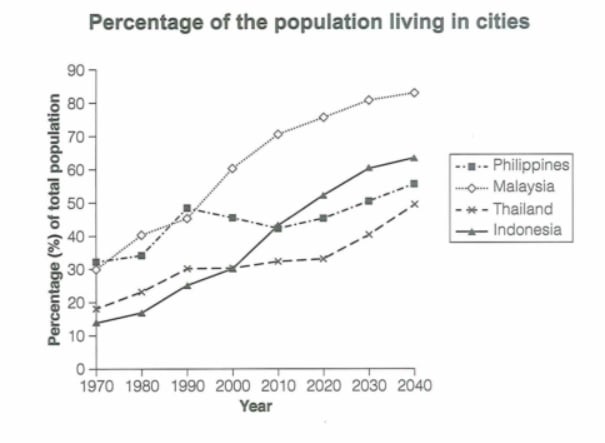
The graph below gives information about the percentage of the population in four Asian countries living in cities from 1970 to 2020, with predictions for 2030 and 2040. Summarize the information by selecting and reporting the main features and make comparisons where relevant.
Student answer (Band 6.0)
The line chart illustrates changes in the percentage of the population living in urban areas among four countries from 1970 to 2040.
Looking first at Malasiya, the figure stood at 30% in 1970. It then rose to 40 percent in 1980. After that it grew further reaching 75% in 2020, and with prediction it will reach 80% in 2040. Furthermore, Indonesia started at 15% in 1970 & climbed to 25 % after two decades. It then increased further to 50 percent in 2020, with prediction it will reach 55 % in 2030 and 60% in 2040.
Turning to Phillippines, the figure was 30 % of total population initially. It fluctuated between 31 percent to 42 % from 1970 to 2020 before it will the 53 percentage at the end of the period. In addition, Thailand stood at 19% in 1970, After that in next 20 years it climbed to 30 percentage of total population and then show stability till 2020. Next, with prediction in 2040 it will reach 45 percent.
Overall, Malasiya and Indonesia experienced a significant increase over the period. Meanwhile Phillippines fluctuated,whereas Thailand remained relatively stable.
AI examiner evaluation
| Criterion | Band |
|---|---|
| Task Achievement / Task Response | 6.5 |
| Coherence and Cohesion | 6.5 |
| Lexical Resource | 6.0 |
| Grammatical Range and Accuracy | 5.5 |
| Overall | 6.0 |
Task Achievement / Task Response: Band 6.5
You provide a clear introduction and an overall summary, and you select relevant figures for all four countries. The main patterns are generally captured: Malaysia and Indonesia rise substantially, the Philippines fluctuates, and Thailand grows more gradually. Several details, however, are inaccurate or incomplete. Malaysia is reported at 75% in 2020 and 80% in 2040, rather than approximately 76% and 84%; Indonesia’s 2030 and 2040 figures are understated, at about 61% and 64%, not 55% and 60%. The Philippines’ range is also misstated: it reaches about 48% in 1990 and falls to around 43% in 2010, rather than fluctuating between 31% and 42%. Your overview is relevant, but could more clearly highlight Malaysia’s highest projected level and Indonesia’s strong rise.
Coherence and Cohesion: Band 6.5
The response is arranged in a sensible sequence: introduction, country-by-country details, and a concluding overview. Paragraphing helps distinguish the groups of trends, and transitions such as “Looking first,” “Turning to,” and “In addition” guide the reader through the comparisons. This gives the report a coherent overall structure. However, some linking is mechanical, and the final overview repeats earlier points without adding a particularly clear comparison of the countries’ relative positions. The Philippines section also moves from its initial figure to a broad range, then to the endpoint, making the trend harder to follow. Use more precise links between stages—for example, contrast its 1990 peak with the subsequent decline—and make references such as “the figure” unambiguous.
Lexical Resource: Band 6.0
You use an adequate range of vocabulary for describing trends, including “rose,” “climbed,” “fluctuated,” “significant increase,” and “relatively stable.” These choices make the main information understandable, and some variation avoids excessive repetition. However, several expressions are imprecise or awkward, such as “with prediction,” “show stability,” and “reach 45 percent” when describing a forecast. Country names are also misspelled as “Malasiya” and “Phillippines,” and “percentage” is sometimes used where “percent” or “percentage of the population” would be more natural. To improve precision, use conventional trend language consistently, such as “is projected to reach,” “remained broadly stable,” and “urban population share.” Check spelling of names and avoid switching between “figure” and “percentage” in ways that obscure what is being measured.
Grammatical Range and Accuracy: Band 5.5
You attempt a mix of simple and more complex sentences, including time clauses and participial phrasing, and the overall meaning is usually clear. Some sentences are controlled, such as “It then rose to 40 percent in 1980.” However, errors in verb forms and sentence construction remain. In “before it will the 53 percentage,” the verb is missing or malformed; “then show stability” needs a past-tense verb; and “with prediction it will reach” needs a more complete grammatical construction. Tense also shifts inconsistently between past reporting and future projections. Punctuation and capitalisation are uneven, as in “1970, After that,” and the ampersand is unsuitable in formal prose. Use past tense for observed years and a consistent future or projected form for forecast years, then proofread each clause for a complete verb.
See this exact question answered at other band scores. The same prompt compared across bands.
Browse more IELTS Writing model answers or get your own writing scored by the same AI examiner.