Band 5.5 IELTS Writing Task 1 Model Answer
Overall Band Score: 5.5 · Cambridge IELTS 18 · 2026-11-08
IELTS Writing Task 1 question
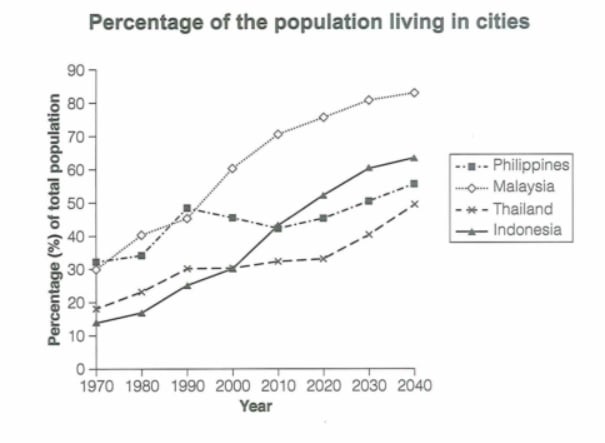
The graph below gives information about the percentage of the population in four Asian countries living in cities from 1970 to 2020, with predictions for 2030 and 2040. Summarize the information by selecting and reporting the main features and make comparisons where relevant.
Student answer (Band 5.5)
The below chart illustrate the information about the percentage of the population in four Asian countries which is Philippines, Malaysia, Thailand and Indonesia in the period of 1970 to 2020, with predictions for 2030 and 2040.
Overall, the population of Indonesia in 1970 is round about 12% approximately which grew rapidly in the next forty years and styed at 29% in the year 2000 with time duration Indonesian population grew more in the cities and the percentage become 50% in the year 2020. Furthermore, population in Indonesia is predicted 63% in cities at 2040.
Philippines population is about 31% in 1970 then styed at 49% in the year 1990 then the population fell in cities and styed at 43% in the year 2020. In addition, prediction is that in future the population is this country is rise and the amount of citizen will be 63%.
Malaysian population in cities at 1970 is 30% it grew very fast with time and in 2020 the population of Malaysian citizens is about 73% and the prediction is that in 2040 it will become 83%.
In Thailand the population in 1970 is round about 19% in cities then the percentage of population reach 30% in 2020. Moreover, the prediction is that the population grew there too about 33% more.
AI examiner evaluation
| Criterion | Band |
|---|---|
| Task Achievement / Task Response | 5.5 |
| Coherence and Cohesion | 5.5 |
| Lexical Resource | 5.0 |
| Grammatical Range and Accuracy | 5.0 |
| Overall | 5.5 |
Task Achievement / Task Response: Band 5.5
You cover all four countries and include some relevant figures and forecasts, so the response addresses the main subject. However, the account is largely a sequence of country-by-country details rather than a clear overview of the most important comparisons. For example, you do not identify Malaysia as the highest throughout most of the period and projected to remain highest, or Indonesia as showing the strongest sustained rise. Some figures and trends are inaccurate: the Philippines reaches about 48% in 1990, not 49%, and its 2020 figure is about 45.5%, not 43%; Thailand is about 33.5% in 2020, not 30%. The forecast that Thailand will grow “33% more” is unclear and unsupported. Select key trends and compare them accurately.
Coherence and Cohesion: Band 5.5
The response has a basic paragraph structure, with an introduction followed by separate discussion of the countries, and linking expressions such as “Overall,” “Furthermore,” and “In addition” help signal relationships. However, the overall progression is not consistently clear: the overview focuses mainly on Indonesia, while the remaining paragraphs list figures without bringing the countries together for comparison. Several sentences run multiple ideas together, particularly the Indonesia paragraph, making the sequence of past change and prediction difficult to follow. Repeated use of “then” and “Moreover” also makes cohesion feel mechanical. A clearer overview followed by logically grouped comparisons—for example, the highest urbanisation levels versus the fastest-growing countries—would make the information easier to follow.
Lexical Resource: Band 5.0
You use some relevant topic vocabulary, including “percentage,” “predicted,” “population,” and “grew rapidly,” and the reader can generally understand the intended trends. However, the range is limited and several word choices or collocations are inaccurate or repetitive. Phrases such as “population of Indonesia … is round about 12%” confuse the population with the proportion living in cities, while “the amount of citizen” is not a natural way to describe a percentage. “Styed” is misspelled repeatedly, and “the population grew there too about 33% more” does not express the forecast clearly. Use precise terms such as “urban population” or “share living in cities,” and vary trend language while checking spelling and natural collocations.
Grammatical Range and Accuracy: Band 5.0
You attempt some longer sentences and use basic past and future forms, but the range of structures is limited and errors occur frequently. The opening has subject–verb disagreement: “The below chart illustrate” should be “The chart below illustrates.” Tense and sentence construction are also problematic in “the population … in 1970 is … which grew,” where past-time information needs consistent past forms. Several clauses are joined without clear punctuation, especially the long sentence beginning “with time duration,” and articles and prepositions are often missing or misplaced. These errors sometimes make relationships between figures and time periods difficult to understand. Practise writing shorter, complete sentences first, then combine them with accurate clauses such as “while” or “whereas.”
See this exact question answered at other band scores. The same prompt compared across bands.
Browse more IELTS Writing model answers or get your own writing scored by the same AI examiner.