Band 4.0 IELTS Writing Task 1 Model Answer
Overall Band Score: 4.0 · Cambridge IELTS 12 · 2026-11-06
IELTS Writing Task 1 question
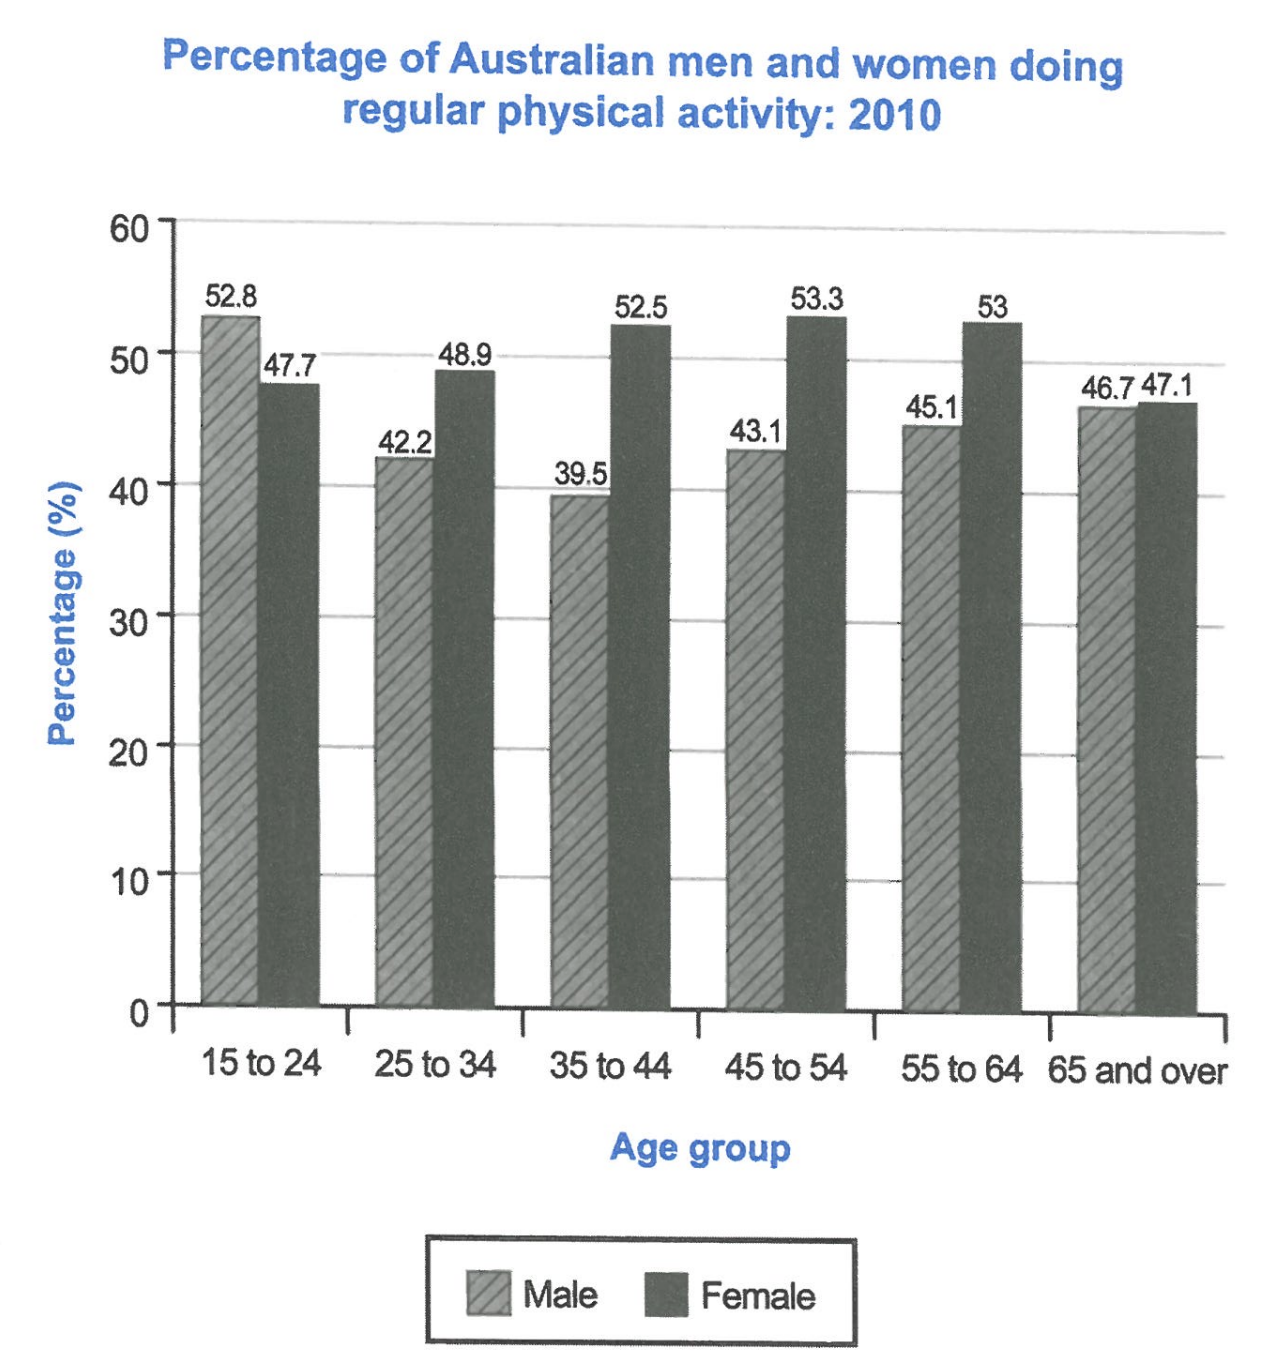
The bar chart below shows the percentage of Australian men and women in different age groups who did regular physical activity in 2010.
Summarise the information by selecting and reporting the main features, and make comparisons where relevant.
Student answer (Band 4.0)
The bar graph illustrate the perecentage of australian male and female in different age who did regular physical activity in 2010
overall, graphs shows the age cateogries of male between 15 to 24 is 52.8 and its flaucts in the women cateogries age group from 45 to 54 is 53.3
AI examiner evaluation
| Criterion | Band |
|---|---|
| Task Achievement / Task Response | 3.0 |
| Coherence and Cohesion | 4.0 |
| Lexical Resource | 4.5 |
| Grammatical Range and Accuracy | 4.5 |
| Overall | 4.0 |
Task Achievement / Task Response: Band 3.0
The response identifies the chart’s subject and includes two accurate figures: 52.8% for men aged 15–24 and 53.3% for women aged 45–54. However, it does not summarise the main patterns or make meaningful comparisons across the age groups. For example, it misses that men’s activity falls to 39.5% at ages 35–44 before rising, while women’s rate is highest around ages 35–64 and exceeds men’s in every group except 15–24. The overview is unclear, and the response is far below the required 150 words, leaving the task only minimally addressed. To improve, report the overall gender pattern, key highs and lows, and several relevant comparisons in a complete summary.
Coherence and Cohesion: Band 4.0
There is a basic attempt to organise the response: an opening sentence introduces the chart, followed by a separate overview beginning with “overall.” This gives the reader a simple starting structure. However, the second sentence combines figures and trends in a way that is difficult to follow, and the relationship between the male and female data is not clearly expressed. The response also ends without developing or concluding its summary. Use a clear sequence: introduce the chart, give an overview of the main trends, then compare the age groups with supporting figures. Linking expressions such as “whereas,” “by contrast,” and “in comparison” would help make those relationships explicit.
Lexical Resource: Band 4.5
The response uses a few relevant terms, including “bar graph,” “age group,” and “regular physical activity,” so the topic is recognisable. However, the vocabulary range is very limited, and several spelling errors—“perecentage,” “cateogries,” and “flaucts”—make the writing less clear and less professional. Some phrasing is also imprecise: “the age categories of male between 15 to 24 is 52.8” does not naturally describe a percentage. Use accurate chart language such as “the proportion of men,” “stood at,” “peaked at,” and “declined before rising.” Check spelling carefully and choose terms that describe the data rather than merely naming the chart.
Grammatical Range and Accuracy: Band 4.5
The response attempts two sentences, including an overview, but the grammatical structures are very limited and several errors make the relationships between ideas unclear. In “The bar graph illustrate,” the singular subject requires “illustrates”; “the age categories of male … is 52.8” also has faulty agreement and sentence construction. The second sentence lacks a clear grammatical link between the male figure and the female age group. Capitalisation at the start of “overall” and for “Australian” also needs attention. Practise writing complete, direct comparisons, for example: “Men’s participation was highest among those aged 15–24, whereas women’s rate peaked among 45–54-year-olds.” This would improve both control and clarity.
See this exact question answered at other band scores. The same prompt compared across bands.
Browse more IELTS Writing model answers or get your own writing scored by the same AI examiner.