Band 4.5 IELTS Writing Task 1 Model Answer
Overall Band Score: 4.5 · Cambridge IELTS 12 · 2026-11-06
IELTS Writing Task 1 question
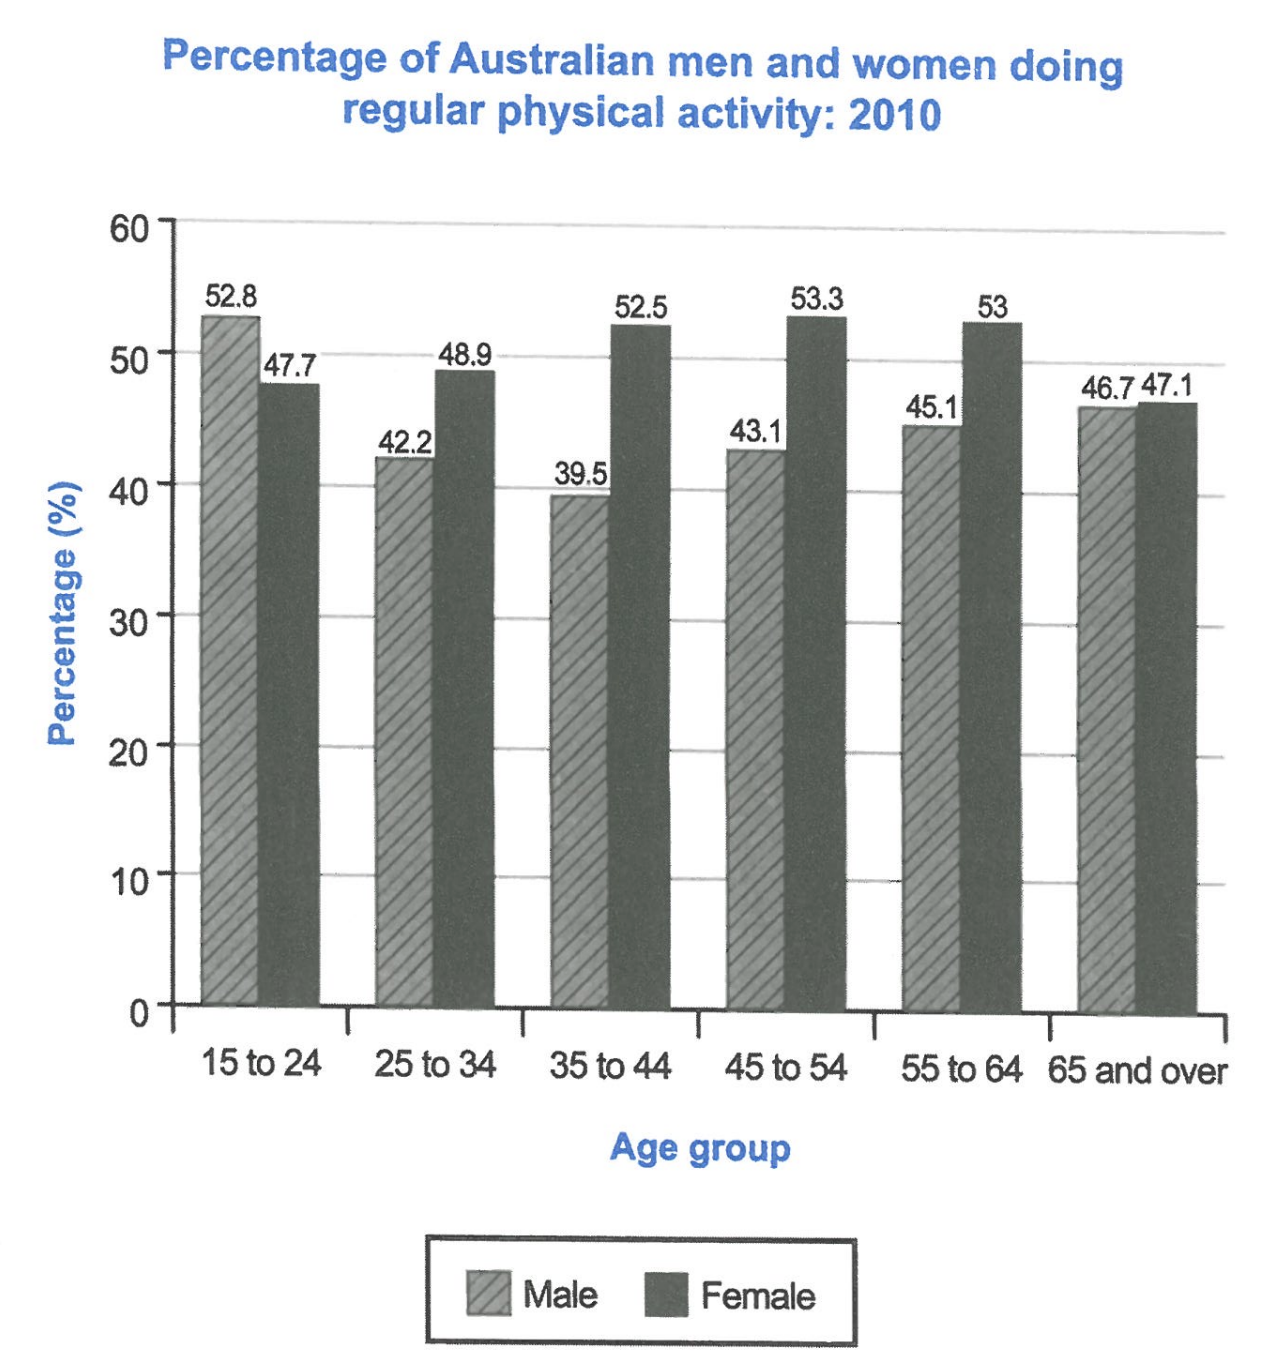
The bar chart below shows the percentage of Australian men and women in different age groups who did regular physical activity in 2010.
Summarise the information by selecting and reporting the main features, and make comparisons where relevant.
Student answer (Band 4.5)
The bar chart illustrates the percentage of australian men and women in different age groups who did regular physical activity now i will summarise this graph.
The bar chart says, we have to explain this bar chart the bar chart is telling that i have to illustrates the men and women percentage but here is given 12 percentages but i will do seperate these percentages.
First of all, the young people was 15 to 24 years old men prcentage was 52.8% and the women who were between 15 to 24 years old thier percentage was 47.7%, second and the men who were between 25 to 34 the men percentage was 42.2% menmwhile the women who were between 25 to 34 thier percentage was 48.9%then the men who were between 35 to 44 thier physical activity pecentage was 39.5%, whenever the women who were between 35 to 44 thier percentage was 52.5%.
Secondly the men who were between 45 to 54 thier percentage was 43.1% and the women who were between 45 to 54 thier percentage was 53.3%, menwhile the men who were between 55 to 64 thier percentage was 45.1% then the women who were between 55 to 64 thier percentage was 53% then the men who were of 65 and its over thier percentage was 46.7% and the women of 65 and its over thier percentage was 47.1%
AI examiner evaluation
| Criterion | Band |
|---|---|
| Task Achievement / Task Response | 4.0 |
| Coherence and Cohesion | 4.0 |
| Lexical Resource | 4.5 |
| Grammatical Range and Accuracy | 4.5 |
| Overall | 4.5 |
Task Achievement / Task Response: Band 4.0
You report all six age groups and give the male and female figures accurately, so the reader can identify the data being compared. However, the response mainly lists values rather than summarising the chart’s main features. It does not provide a clear overview, such as noting that men’s activity was highest among the youngest group and lowest at ages 35–44, while women’s rates were generally higher except among 15–24-year-olds. The opening also says “now i will summarise this graph” and “i have to explain this bar chart,” which do not add relevant analysis. To strengthen the response, select the key trends and comparisons, then use a few figures to support them rather than reporting every pair in sequence.
Coherence and Cohesion: Band 4.0
There is a basic attempt to organise the information: the response begins with an introduction, then uses “First of all” and “Secondly” to divide the age groups. The figures are generally presented in age-group order, which gives the reader some structure. However, the first two paragraphs repeat the task instead of developing the report, and the long sentences in the data paragraphs run several comparisons together. Connectors such as “then,” “whenever,” and “meanwhile” are repetitive or do not clearly show the relationship between the figures. Use separate paragraphs for an overview and the main comparisons, and group age groups with similar patterns. Shorter sentences and clearer linking would make the progression easier to follow.
Lexical Resource: Band 4.5
The response uses relevant basic terms, including “percentage,” “age groups,” “men,” “women,” and “physical activity,” and the intended comparisons are usually understandable. However, vocabulary is repetitive and sometimes imprecise: “the bar chart is telling” and “i have to illustrates” are not natural ways to describe data, while “seperate these percentages” does not clearly express the intended point. There are also frequent spelling errors, including “prcentage,” “thier,” and “pecentage,” which weaken control of written vocabulary. Build a small set of accurate chart-reporting expressions, such as “the proportion of,” “stood at,” and “was higher than,” and check spelling carefully before submitting.
Grammatical Range and Accuracy: Band 4.5
You attempt to report comparisons using clauses joined with “and,” “then,” and “while,” and the numerical statements are often understandable. However, sentence structures are mostly repetitive and frequently become run-ons, as in the sentence beginning “First of all, the young people was 15 to 24 years old.” There are recurring errors in verb forms and agreement, including “the young people was” and “i have to illustrates,” as well as inconsistent sentence punctuation and capitalisation. These problems make the report less clear and show limited control of sentence construction. Practise writing short, complete comparison sentences—for example, “Among 15–24-year-olds, the male figure was 52.8%, compared with 47.7% for females”—and check each sentence for a clear subject and verb.
See this exact question answered at other band scores. The same prompt compared across bands.
Browse more IELTS Writing model answers or get your own writing scored by the same AI examiner.