Band 6.5 IELTS Writing Task 1 Model Answer
Overall Band Score: 6.5 · Cambridge IELTS 12 · 2026-11-08
IELTS Writing Task 1 question
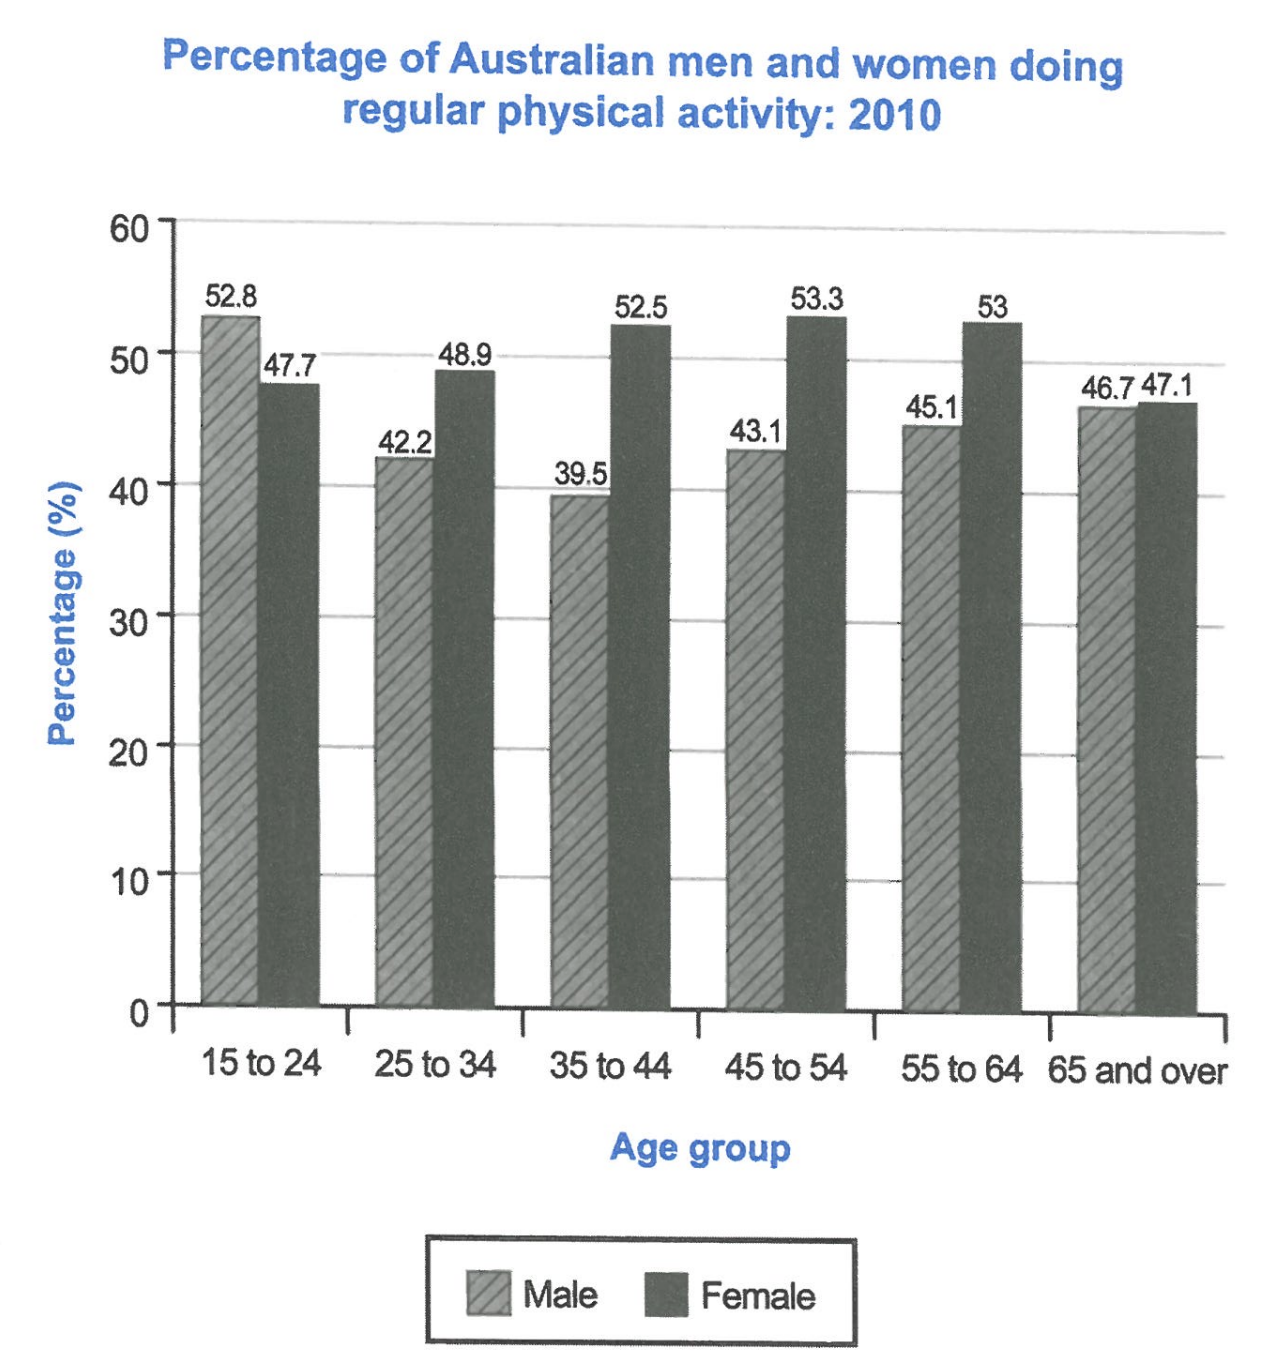
The bar chart below shows the percentage of Australian men and women in different age groups who did regular physical activity in 2010.
Summarise the information by selecting and reporting the main features, and make comparisons where relevant.
Student answer (Band 6.5)
The bar chart illustrates the proportion of Australian male and female citizens, categorized by different age brackets, involved in regular physical activity in 2010.
Overall, it is evident that females of all age group were more involved in the physical activities compared to the male citizens except the younger generation. In addition, the women of 45-54 age bracket performed the highest percentage of physical labour.
Looking at the dataset more clearly, it can be seen that highest number of male citizens involved in physical activity was from the age group 15 to 24 around 52.8% while that of the similar aged female accounted for roughly 47.7%. However, in the following age groups, the percentage for men went down and that of the women raised upward. From the age group of 35 to 44, lowest number of men reported to do physical work which was around 39.5% compared to the women growing to 52.5%.
Turning to the rest of the data, it is clear that women who aged 45-54 accounted for the highest number with around 53.3% whilst the percentage for men was slightly more than previous groups with 43% which was still lower than women. In the subsequent age groups, the proportion of male was still lower than that of the female even though their percentage of doing physical labour was less in these groups.
AI examiner evaluation
| Criterion | Band |
|---|---|
| Task Achievement / Task Response | 6.5 |
| Coherence and Cohesion | 6.5 |
| Lexical Resource | 6.0 |
| Grammatical Range and Accuracy | 6.0 |
| Overall | 6.5 |
Task Achievement / Task Response: Band 6.5
You provide a clear overview and identify two important features: men lead only in the youngest group, while women have higher participation in the other age groups, and the female peak is 53.3% among 45–54-year-olds. The figures for the youngest and 35–44 groups are also accurately reported. This gives the response a sound account of the main pattern. However, the final comparison is less fully developed: you say men remain lower in the later groups but do not report the female figures or explain that women’s rate stays around 53% through ages 45–64 before falling to 47.1%. Also, “the women of 45–54 age bracket performed the highest percentage” is imprecise: it is the highest female participation rate, not a measure of performance or physical labour. More precise coverage of the later data would strengthen the response.
Coherence and Cohesion: Band 6.5
The response is arranged in a clear sequence: an introduction, an overview, then paragraphs covering the younger and older age groups. Linking phrases such as “Overall,” “However,” and “Turning to the rest of the data” help signal the direction of the comparison. The organisation is coherent, though some connections are mechanical and the final paragraph repeats the general point that men’s figures are lower without adding much detail. References such as “these groups” are understandable but could be more specific. To make progression more effective, group the data around the main trends—for example, the male decline and recovery, then the female rise and later fall—and use the figures to develop each comparison rather than relying on broad statements.
Lexical Resource: Band 6.0
You use an adequate range of task-related vocabulary, including “proportion,” “age brackets,” “accounted for,” and “subsequent.” These choices help describe the chart, and the meaning is generally clear. However, some less common expressions are inaccurate or unnatural: “physical labour” suggests work rather than exercise, “performed the highest percentage” is an awkward collocation, and “the percentage for the women raised upward” is not idiomatic. Repeated use of “number” is also unsuitable when describing percentages. Choose precise chart language consistently, such as “participation rate,” “was highest,” and “increased.” This would improve accuracy and flexibility while preserving the clear meaning of your comparisons.
Grammatical Range and Accuracy: Band 6.0
You use a mix of simple and complex sentence forms, including clauses introduced by “while,” “compared to,” and “even though.” Most sentences communicate the intended comparisons, and the overall meaning remains clear. Some grammatical errors persist, particularly with agreement and articles: “females of all age group” should be “females in all age groups,” and “the highest number of male citizens … was” needs a plural or a different construction. The phrase “women who aged 45-54” also needs a relative clause such as “women who were aged 45–54.” There are occasional awkward sentence constructions and punctuation spacing, but these do not prevent understanding. Review plural forms, article use, and clause structure to make complex sentences more consistently accurate.
See this exact question answered at other band scores. The same prompt compared across bands.
Browse more IELTS Writing model answers or get your own writing scored by the same AI examiner.