Band 5.5 IELTS Writing Task 1 Model Answer
Overall Band Score: 5.5 · Cambridge IELTS 12 · 2026-11-09
IELTS Writing Task 1 question
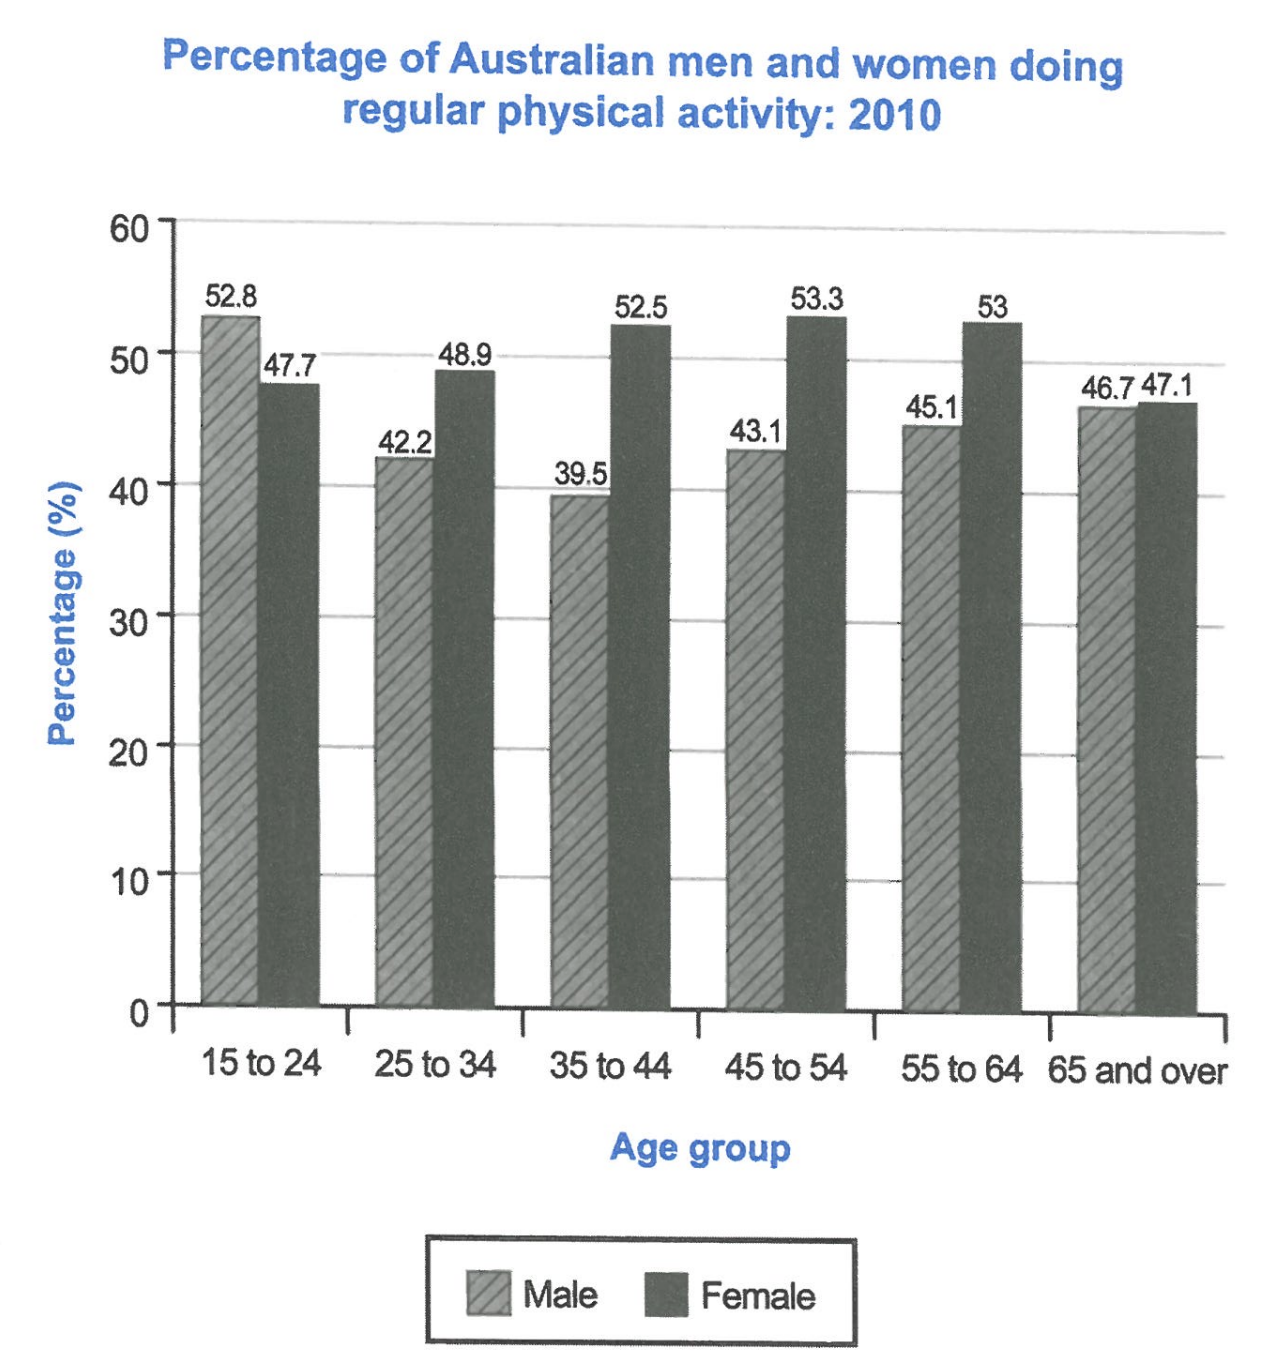
The bar chart below shows the percentage of Australian men and women in different age groups who did regular physical activity in 2010.
Summarise the information by selecting and reporting the main features, and make comparisons where relevant.
Student answer (Band 5.5)
The given graph elucidates the information about the propotion of Australian male and female in various lifespend groups who did daily physical activity in 2010
Overall,it is clearly seen that female ratio was higher in all the age groups except the first given age bracket.
Taking more details into account,in the age of 15 to 24,male ratio accounts higher than female which was 52.8 and 47.7 respectively ,moreover in 25 to 34 age group female shows almost 7% more ratio than male similarly, In 35 to 44, male ratio was 39.5% and female ratio was 52.5%.
Furthermore, the maximum ratio of women was 53.3% in daily exercise while minimum in women which is 43.1% In addition,the ratio of female was 53% which is more than male ratio which is 45.1%explaining the pending details, 65 or above age group, the ratio of both male and female is almost similar which is 46.7% and 47.1%
AI examiner evaluation
| Criterion | Band |
|---|---|
| Task Achievement / Task Response | 6.0 |
| Coherence and Cohesion | 5.5 |
| Lexical Resource | 5.5 |
| Grammatical Range and Accuracy | 5.0 |
| Overall | 5.5 |
Task Achievement / Task Response: Band 6.0
You identify the main overall contrast: women recorded higher activity rates in every age group except 15–24, and you include several relevant figures, such as 52.8% versus 47.7% for the youngest group and 46.7% versus 47.1% for those aged 65 and over. However, some key features are not fully or clearly reported. The claim that women’s minimum was 43.1% is inaccurate: 43.1% is the male figure for ages 45–54, while women’s lowest rate was 47.1% among the oldest group. The overview could also describe the contrasting trends more clearly: men’s rate falls before rising, while women’s rate generally rises to a middle-age peak and then declines. More precise selection and explanation of these patterns would strengthen the summary.
Coherence and Cohesion: Band 5.5
The response has a recognisable structure, with an opening, an overview and detail paragraphs, and it moves broadly from younger to older age groups. This gives the reader a basic route through the information. However, progression becomes difficult to follow in the final paragraph: the maximum and minimum for women are introduced, then the 55–64 comparison, and then the oldest group, with the 45–54 figures not clearly explained. Linking phrases such as “Furthermore,” “In addition,” and “explaining the pending details” do not consistently show how the facts relate, and some sentences run together without clear punctuation. Grouping the age ranges into a clear sequence and using simpler links to signal comparisons would make the organisation more coherent.
Lexical Resource: Band 5.5
You attempt a range of task-related vocabulary, including “proportion,” “age bracket,” “maximum,” and “minimum,” and the reader can generally understand that you are comparing activity rates. However, several choices are inaccurate or unnatural, which limits precision: “lifespend groups” is not an appropriate term for age groups, “daily physical activity” changes the chart’s meaning of regular activity, and “female ratio” is less suitable than “the proportion of women” or “the female rate.” “Elucidates” is also an awkward choice for introducing a chart. There are spelling errors, including “propotion,” and repeated use of “ratio” makes the description less flexible. Prefer standard chart language and vary it carefully without changing the data’s meaning.
Grammatical Range and Accuracy: Band 5.0
You attempt both simple statements and longer sentences, and the main comparisons are usually understandable. However, control is inconsistent, especially when several ideas are joined in one sentence. For example, “Furthermore, the maximum ratio of women was 53.3% in daily exercise while minimum in women which is 43.1%” lacks a clear grammatical structure, and the later sentence beginning “In addition” runs directly into “explaining the pending details.” There are also issues with articles, agreement and sentence boundaries, as in “Australian male and female” and “the ratio of both male and female is.” Use complete sentences with a clear subject and verb, and check commas and full stops. More accurate control of these patterns would make your comparisons easier to read.
See this exact question answered at other band scores. The same prompt compared across bands.
Browse more IELTS Writing model answers or get your own writing scored by the same AI examiner.