Band 6.0 IELTS Writing Task 1 Model Answer
Overall Band Score: 6.0 · Cambridge IELTS 12 · 2026-11-09
IELTS Writing Task 1 question
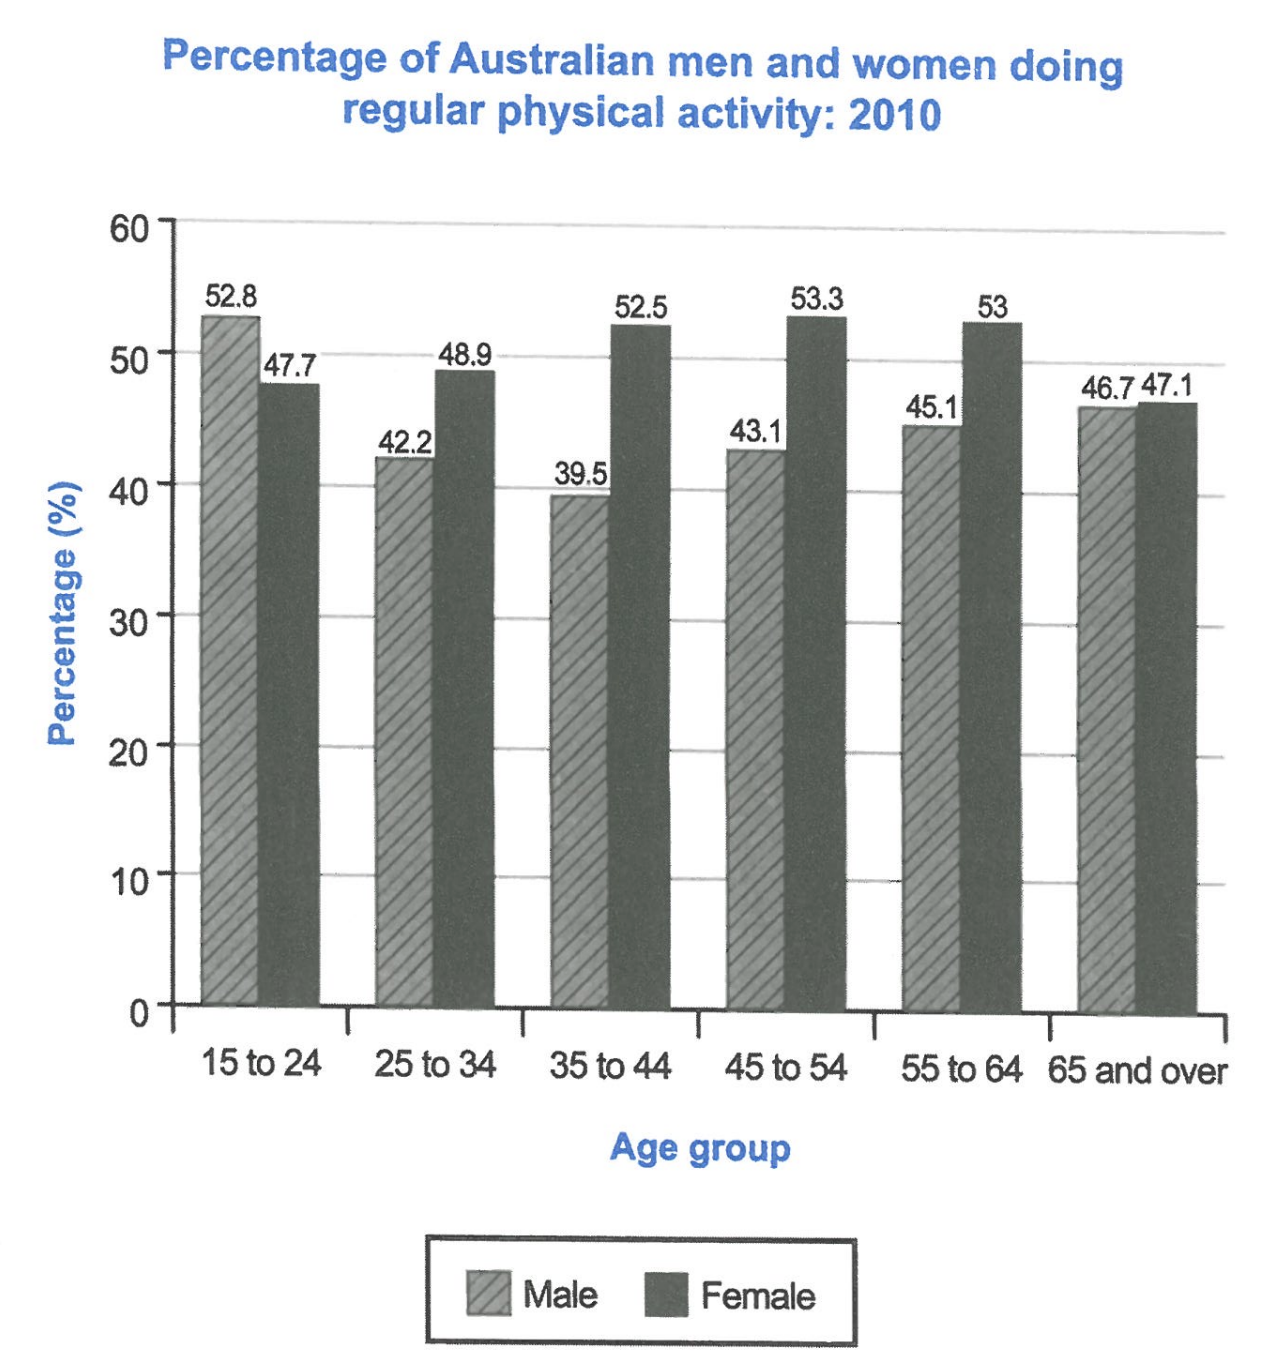
The bar chart below shows the percentage of Australian men and women in different age groups who did regular physical activity in 2010.
Summarise the information by selecting and reporting the main features, and make comparisons where relevant.
Student answer (Band 6.0)
This chart illustrate the percentage of both genders and their physical activity across their ages.
We notice that female category have the highest percentage of physical activity during all ages except in the category from 15 to 24 years old, which had the men recording a 52.8% and the female with 47.7%.
The men category decrease significantly after the age of 24 years old until they reach their lowest percentage at 39.5% in 9 years between 35 and 44 years old, while the females had reached a peak at the ages from 45 to 54 years old. Furthermore, males category record a small recovery after 44 years old and rise a bit to 45.1% in the nine years between 55 and 64 years old.
At the end we see that both genders get to a close percentage of physical activity, and they record 46.7% for males and 47.1% for females.
AI examiner evaluation
| Criterion | Band |
|---|---|
| Task Achievement / Task Response | 6.0 |
| Coherence and Cohesion | 6.0 |
| Lexical Resource | 6.0 |
| Grammatical Range and Accuracy | 5.5 |
| Overall | 6.0 |
Task Achievement / Task Response: Band 6.0
You identify the main gender pattern: men have the higher figure among 15–24-year-olds, while women lead in the other age groups, and you note that the final figures are close. You also report several key values accurately, including the male low of 39.5% and the female peak of 53.3%. However, the overview is not fully precise: women’s activity does not rise to a peak only at 45–54, since it increases across the earlier groups before remaining almost level at 55–64. The account also omits the female figures for several groups and gives little comparison of the middle-age gap. Clarify the overall trends and support them with a few well-chosen comparisons rather than describing isolated points.
Coherence and Cohesion: Band 6.0
The response has a clear overall sequence: it introduces the chart, compares the younger group, describes changes through middle age, and ends with the oldest group. Paragraphing helps separate these stages, and linking expressions such as “Furthermore” and “At the end” make the progression visible. Some connections are nevertheless mechanical or imprecise. “At the end” is less suitable than a direct reference to the oldest age group, and the shift from the female peak to the male recovery could be linked more clearly as a comparison. The opening sentence also does not establish an overview of the main trends. Organise the body around the contrasting male and female patterns, and use concise references such as “by contrast” or “whereas” to make relationships clearer.
Lexical Resource: Band 6.0
You use an adequate range of task-related vocabulary, including “percentage,” “lowest,” “peak,” “recovery,” and “close percentage,” so the chart’s main movements are generally understandable. There are also attempts to vary wording rather than repeat “increase” throughout. However, several choices are unnatural or imprecise: “both genders and their physical activity across their ages” is awkward, “category” is repeatedly used for people, and “rise a bit” is too informal for an academic report. “Nine years between 35 and 44” also mislabels an age band rather than describing the group. Choose standard chart language such as “proportion,” “age group,” “declined,” and “rose slightly,” and use “women” and “men” directly.
Grammatical Range and Accuracy: Band 5.5
You attempt a mixture of simple statements and longer sentences with subordinate clauses, for example, “while the females had reached a peak…” and “At the end we see that…”. The main comparisons remain understandable, but some errors in agreement, tense, articles, and sentence construction reduce accuracy. Examples include “This chart illustrate” instead of “illustrates,” “female category have” instead of “the female category has,” and “males category record” instead of “the male category recorded.” The phrase “which had the men recording” is also an awkwardly formed clause. Use the past tense consistently for the 2010 data and check subject–verb agreement and article use. Shorter, controlled comparison sentences would help you retain variety while improving accuracy.
See this exact question answered at other band scores. The same prompt compared across bands.
Browse more IELTS Writing model answers or get your own writing scored by the same AI examiner.