Band 5.5 IELTS Writing Task 1 Model Answer
Overall Band Score: 5.5 · Cambridge IELTS 12 · 2026-11-09
IELTS Writing Task 1 question
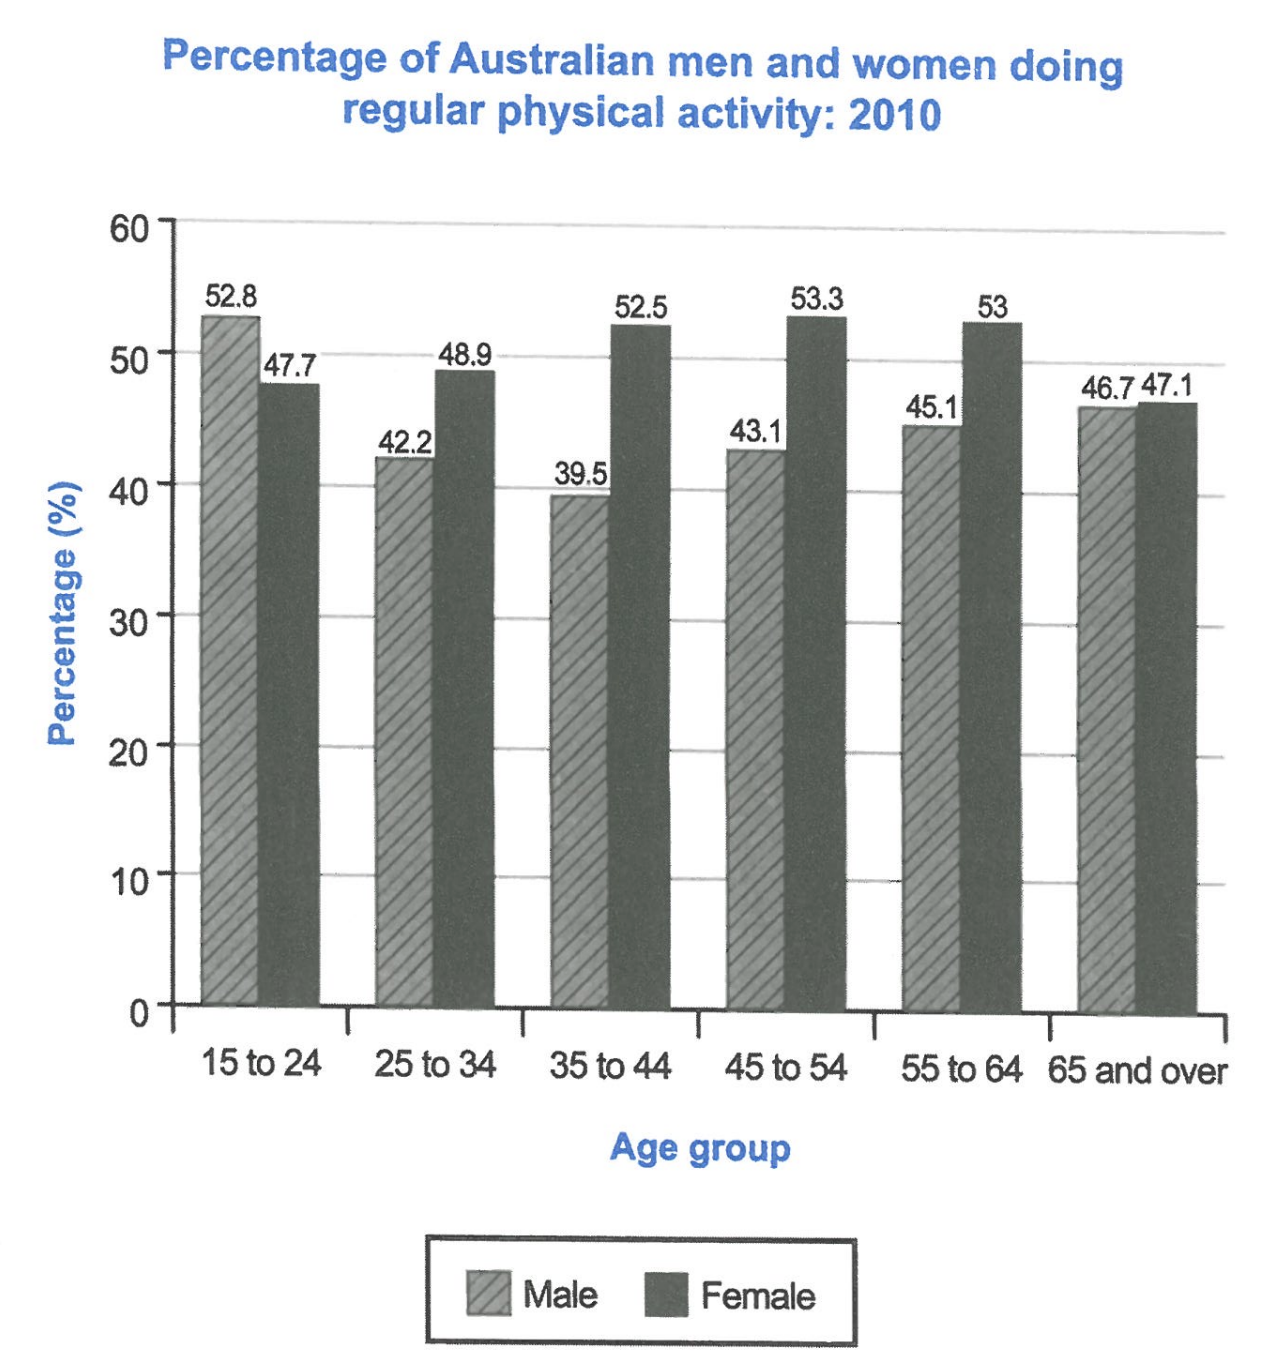
The bar chart below shows the percentage of Australian men and women in different age groups who did regular physical activity in 2010.
Summarise the information by selecting and reporting the main features, and make comparisons where relevant.
Student answer (Band 5.5)
The graph is showing percentage of male and female of different age groups that are participating in the physical activity in 2010.There are total six age groups in the australia.
First age group is fifteen to twenty four years old. In this age group, percentage of boys doing physical activity is greater than girls.
Second age group is 25 to 34 years old boys and girls.on the contrast, percentage of female is significantly on the greater side than boys.in third age group i.e 35 to 44 this gap significantly increased to 13 percent.
The gap decreased as we advanced to fourth age group which is 45 to 54 years old.As we move firwaed to second last age group,this gap decreased furthur.
in the last age group the percentage of man and women become equal.
So the graph is showing comparison of male and female of different age groups based on their physical activity.In the raerly age groups ,male percentage aere higher than female but then female percentage becomes higher.
AI examiner evaluation
| Criterion | Band |
|---|---|
| Task Achievement / Task Response | 5.5 |
| Coherence and Cohesion | 5.5 |
| Lexical Resource | 5.0 |
| Grammatical Range and Accuracy | 5.0 |
| Overall | 5.5 |
Task Achievement / Task Response: Band 5.5
You identify the chart’s subject and make a relevant broad comparison: men lead in the youngest group, while women are higher in most later groups. However, the account is only partly accurate and the main features are under-developed. The claim that the sexes are equal in the oldest group is incorrect: women are at 47.1%, compared with men at 46.7%. The gap in the 35–44 group is about 13 percentage points, but the response does not report the key peak for women (53.3% at 45–54) or the low point for men (39.5% at 35–44). The overview also says men are higher in the “early age groups,” which is misleading because women lead from 25–34 onward. Select and accurately summarise the overall trends and key extremes.
Coherence and Cohesion: Band 5.5
The response has a basic sequence, moving through the age groups and ending with a general summary, so the reader can follow its broad subject. However, progression is largely a list of groups rather than a clear overview followed by organised comparisons. Phrases such as “Second age group” and “in third age group” create a mechanical pattern, while “on the contrast” and “as we move” do not always connect the comparisons precisely. Paragraphing is also limited: the opening, detailed comparisons and conclusion are not clearly separated into purposeful sections. Grouping the youngest category separately from the five older groups would make the shift from male to female dominance clearer. Use a concise overview first, then organise supporting details by trend rather than narrating each category in turn.
Lexical Resource: Band 5.0
The vocabulary is sufficient to identify the chart topic and make basic comparisons, with phrases such as “percentage,” “age groups,” “greater than,” and “gap decreased.” However, the range is limited and several expressions are inaccurate or awkward for describing data. “Boys” and “girls” are unsuitable for adult age categories; use “men” and “women.” “On the greater side” is vague, and “the percentage … become equal” does not accurately describe the small difference in the oldest group. There are also spelling errors, including “firwaed,” “furthur,” and “raerly,” which reduce clarity. Build a more precise set of chart-description terms, such as “higher,” “lower,” “peaked,” and “declined,” and check spelling before submitting.
Grammatical Range and Accuracy: Band 5.0
The response attempts some longer structures, including “As we move … to second last age group,” but most sentences follow a simple, repetitive pattern and errors occur frequently. Examples include “The graph is showing percentage,” “There are total six age groups,” and “percentage of man and women become equal,” where articles, plurals, agreement and verb forms are not controlled. Several sentence boundaries and spaces after full stops are also missing, making the text harder to read. Use accurate present-tense forms to describe the chart, for example, “The chart shows…” and “women’s participation is higher.” Practise combining comparisons with clauses such as “Although men lead among 15–24-year-olds, women record higher figures in every older group.”
See this exact question answered at other band scores. The same prompt compared across bands.
Browse more IELTS Writing model answers or get your own writing scored by the same AI examiner.