Band 5.0 IELTS Writing Task 1 Model Answer
Overall Band Score: 5.0 · Cambridge IELTS 12 · 2026-11-10
IELTS Writing Task 1 question
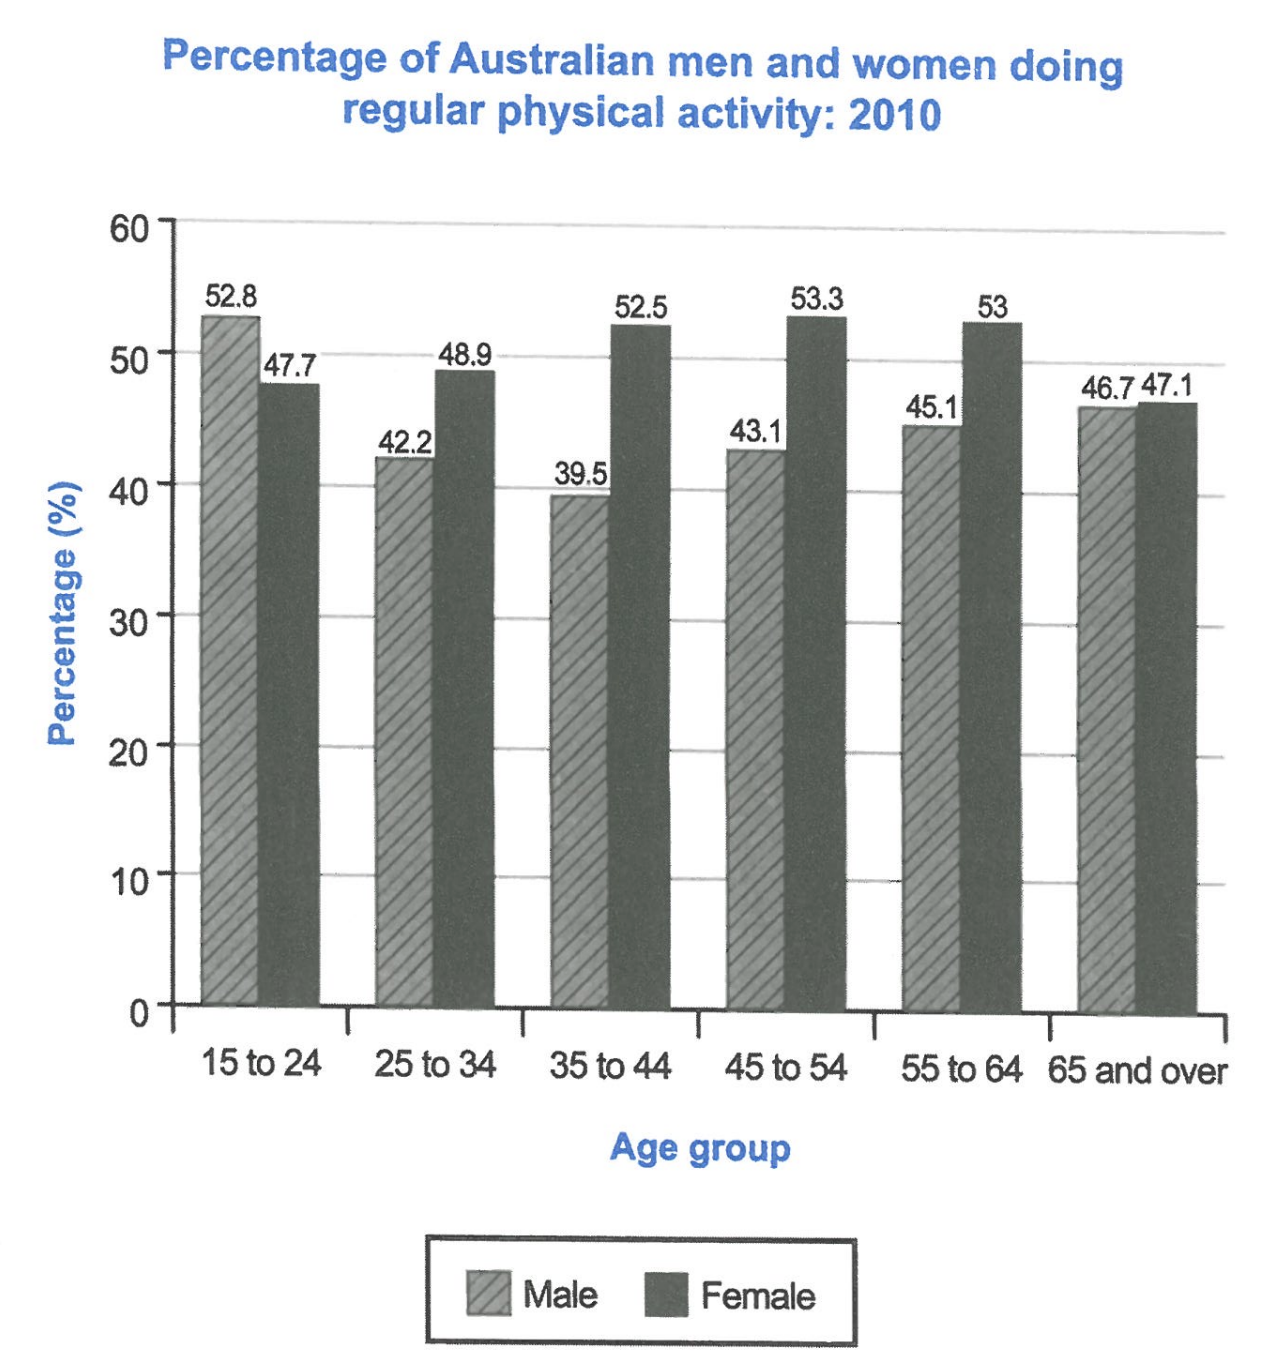
The bar chart below shows the percentage of Australian men and women in different age groups who did regular physical activity in 2010.
Summarise the information by selecting and reporting the main features, and make comparisons where relevant.
Student answer (Band 5.0)
The bar chart illustrate the percentage of the regular physical activities in 2010 of australian men and women .In the age of 55 to 60 the percentage were 53 of the women and 45.1 of men ,this is the highest percentage of the women activity in the graph . But the percentage of men was sharply reduced in the age of 35 to 44 . but the percentage of men activities was increase in the age of 15 to 24 was 52.8 . In addition , mostly the percentage were remaining same in the graph but in the age of 65 and over the percentage of men and women were closely compete to each other the percentage were 47.1 of the women and 46.7 of the men . The graph showes the percentage the activities were increasig in the age of teenage and in the age of 65 and over.because most of individuals have free time in this periode of the age .But the age of 25 to 60 the percentage were ups and downs .
AI examiner evaluation
| Criterion | Band |
|---|---|
| Task Achievement / Task Response | 5.5 |
| Coherence and Cohesion | 4.0 |
| Lexical Resource | 5.0 |
| Grammatical Range and Accuracy | 5.0 |
| Overall | 5.0 |
Task Achievement / Task Response: Band 5.5
You identify relevant comparisons, including the female peak of 53.3% among 45–54-year-olds and the near-equal figures for people aged 65 and over. However, some details are inaccurate: the group with 53% female activity is 55–64, not “55 to 60,” and the claim that activity increased among teenagers is not supported for women, whose figure is lower than men’s in that group. The response also misses the main overall pattern: men’s rate is highest at 15–24 and lowest at 35–44, while women’s rate is generally higher from 25–34 onward. The explanation about people having more free time is speculative and not shown by the chart. A clearer overview and more accurate selection of key trends would strengthen the report.
Coherence and Cohesion: Band 4.0
The response includes several relevant comparisons, and linking expressions such as “In addition” and “But” show an attempt to connect ideas. However, the information is not arranged in a clear progression: figures, trends, and an unsupported explanation are mixed together in one paragraph, with no distinct overview or organised comparison of the age groups. Some links are also unclear or repetitive, as in “mostly the percentage were remaining same” followed by “ups and downs.” The repeated use of “but” does not always show a precise relationship between the points. Group the response into an overview and a paragraph comparing the age patterns for men and women, and use linking phrases that accurately signal contrast or change.
Lexical Resource: Band 5.0
You use some task-relevant vocabulary, including “percentage,” “highest,” “reduced,” and “closely compete,” so the reader can identify the general subject and several comparisons. However, the range is limited and several word choices or collocations are inaccurate, which sometimes makes the meaning difficult to follow. For example, “the percentage of the regular physical activities” is an awkward description of the chart, and “closely compete to each other” does not naturally describe similar figures. There are also spelling and word-form errors such as “showes” and “increasig.” Use precise chart language such as “proportion,” “rose,” “fell,” and “was slightly higher than,” and check spelling and collocations.
Grammatical Range and Accuracy: Band 5.0
You attempt to combine ideas using clauses and contrast markers, for example, “But the percentage of men was sharply reduced in the age of 35 to 44.” However, sentence structures are limited, and frequent errors in agreement, verb forms, articles, and punctuation make several sentences awkward. Examples include “The bar chart illustrate,” “the percentage were,” and “the graph showes”; the sentence beginning “The graph showes…” also lacks a clear grammatical connection to the explanation that follows. Capitalisation and spacing around sentence boundaries are inconsistent. Practise accurate simple comparisons first, then add complex clauses, checking that each subject agrees with its verb and that past-tense forms are consistent.
See this exact question answered at other band scores. The same prompt compared across bands.
Browse more IELTS Writing model answers or get your own writing scored by the same AI examiner.