Band 5.0 IELTS Writing Task 1 Model Answer
Overall Band Score: 5.0 · Cambridge IELTS 12 · 2026-11-10
IELTS Writing Task 1 question
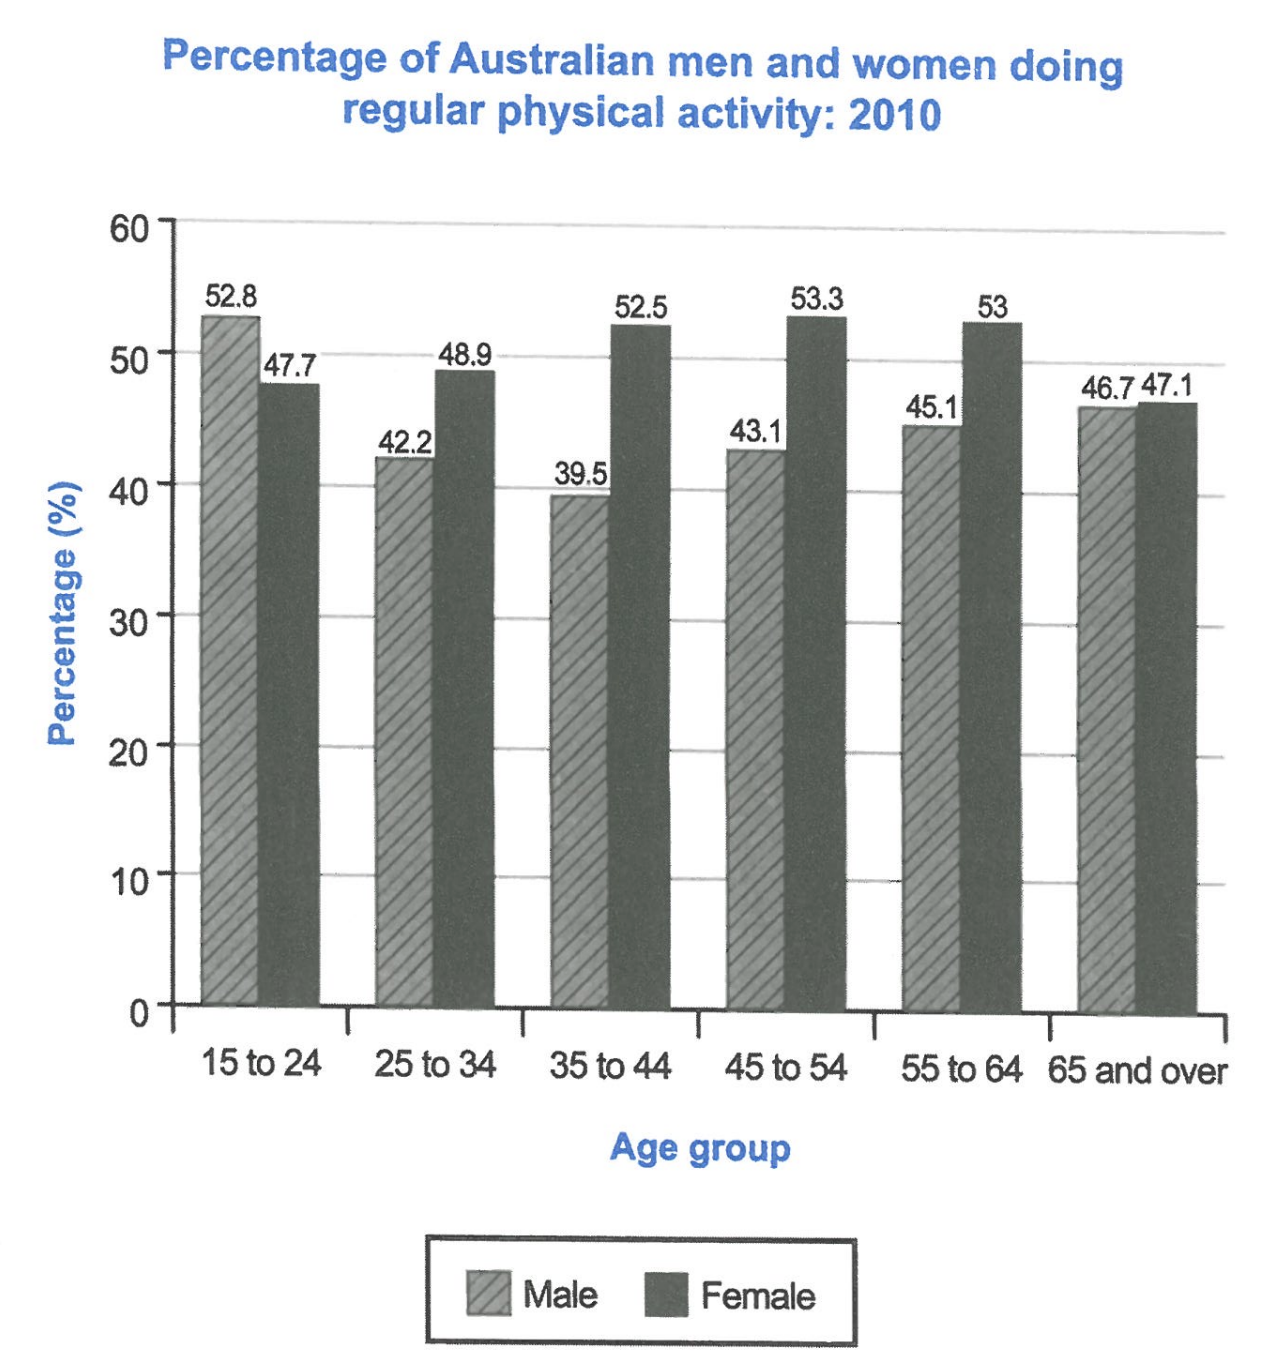
The bar chart below shows the percentage of Australian men and women in different age groups who did regular physical activity in 2010.
Summarise the information by selecting and reporting the main features, and make comparisons where relevant.
Student answer (Band 5.0)
The given bar chart illustrates the proportion of Australian men and women in several age groups who did regular physical activity in 2010, while six classes are shown in the graph.
Overall, in the graph the ratio of famales is higher than the males ratio, while the first category the males percentage is higher than the females proportion and the percentage of males and females in the period of 65 and over both are the ratio is similar.
In the table the first category is 15 to 24 and the males percentage is 52.8 and females ratio is 47.7, in contrast, next category is 65 and over and the percentage of males and females is 46.7 and 47.1, followed by, other category is 25 to 34 and the males ratio is decline than the females ratio and proportion is 45.1 and 53.
In the period of 35 to 44 the females percentage is higher than the males ratio and the ratio is 39.5 males ratio and 52.5 for females ratio, in contrast, with the time frame of 45 to 54 and the males percentage is lower than the females and the percentage is 43.1 and 53.3.
AI examiner evaluation
| Criterion | Band |
|---|---|
| Task Achievement / Task Response | 5.0 |
| Coherence and Cohesion | 5.0 |
| Lexical Resource | 5.0 |
| Grammatical Range and Accuracy | 5.0 |
| Overall | 5.0 |
Task Achievement / Task Response: Band 5.0
You identify the chart’s subject and make a relevant overall comparison: women generally recorded higher activity, while men led in the youngest group and the sexes were close among those aged 65 and over. However, the overview is unclear and does not capture the main pattern precisely: women’s figures peak around ages 35–64, while men’s fall to a low at 35–44 before rising. There is also a significant data error: the figures 45.1 and 53 are assigned to ages 25–34, but they belong to ages 55–64; the 25–34 values are 42.2 and 48.9. Several comparisons are reported, but the selection and accuracy of key features remain limited.
Coherence and Cohesion: Band 5.0
The response has an opening, an overview, and further detail, so there is some organisation. However, the information does not progress clearly: the second detail paragraph jumps from the youngest group to the oldest, then to 25–34, before the final paragraph returns to middle age groups. This makes the comparisons harder to follow. Linking phrases such as “in contrast” and “followed by” are used, but sometimes do not express the relationship between the figures accurately, and repeated references to “the ratio” make the writing feel mechanical. Group the age bands in a consistent order and use clear comparisons, for example, first describing the male trend and then the female trend.
Lexical Resource: Band 5.0
You use some task-relevant vocabulary, including “proportion,” “percentage,” “age groups,” and “physical activity,” and the reader can generally identify the topic of each sentence. However, the range is limited and several word choices or collocations are inaccurate or repetitive. “The ratio of famales” is both misspelled and an unsuitable way to describe the chart’s percentages; “female percentage” or “proportion of women” would be more natural. “The males ratio is decline” also does not express the intended comparison clearly. Repeated use of “ratio” and “percentage” limits precision. Aim for accurate terms such as “figure,” “rate,” and “accounted for,” while checking spelling and choosing expressions that fit statistical descriptions.
Grammatical Range and Accuracy: Band 5.0
The response attempts longer sentences and uses some comparison structures, but complex sentences are often faulty, and errors occur frequently enough to make parts difficult to interpret. For example, “the percentage of males and females in the period of 65 and over both are the ratio is similar” has problems with sentence structure and agreement. In “the males ratio is decline than the females ratio,” the verb form and comparative construction are incorrect. Articles and sentence boundaries also need attention, as in “in the graph the ratio…” and the long sentence beginning “In the table the first category…”. Build clearer sentences around one comparison at a time, and check subject–verb agreement, verb forms, and punctuation.
See this exact question answered at other band scores. The same prompt compared across bands.
Browse more IELTS Writing model answers or get your own writing scored by the same AI examiner.