Band 5.0 IELTS Writing Task 1 Model Answer
Overall Band Score: 5.0 · Cambridge IELTS 12 · 2026-11-10
IELTS Writing Task 1 question
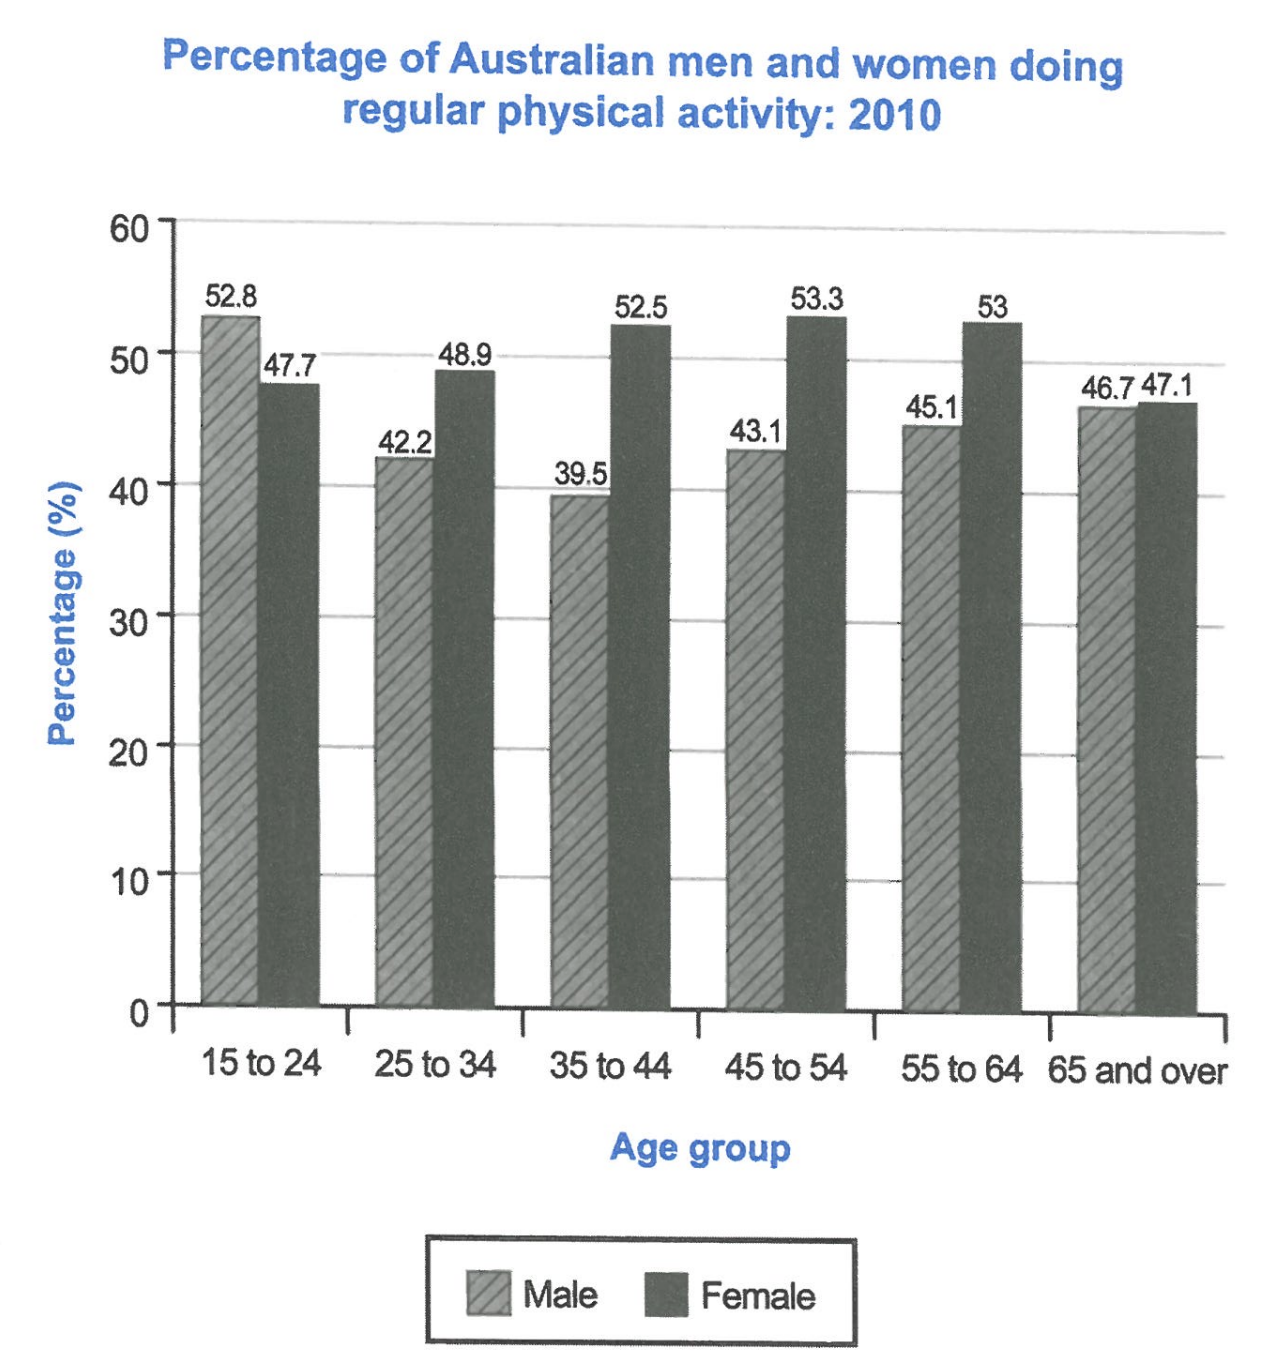
The bar chart below shows the percentage of Australian men and women in different age groups who did regular physical activity in 2010.
Summarise the information by selecting and reporting the main features, and make comparisons where relevant.
Student answer (Band 5.0)
The bar chart illustrates that the proportion of men and women in Australian has different age group who are performing daily physical activity in the year 2010.
Overall, the percentage of each gender has different age groups. Especially, the 15 to 24 has highest percentage in males is 52.8% but females has 53.3% in 45 to 54 age group are punctaul in regular activities.
Firstly, the males has increased 52.8% in 15 to 24 and declined to 39.5 in 35 to 44 age. In between there are many age groups its flactuating by the ages. However, the youngsters ratio is 42.2% moreover the adults have 43.1% additionally 45.1% holding by the elderly peoples mainly, the old age peoples are more oriented about health they have 46.1%.
Secondly, the females ratios is quiet high compared to male. Furthermore, the 53.3% is massive and lowest is 47.1%. Unfortunately, the middle proprtion in manageable adult females has 48.9% and 35 to 44 age group has 52.5%. The 55 to 64 age peoples has 53%. Lastly, the 65 above individuals has 47.1%.
AI examiner evaluation
| Criterion | Band |
|---|---|
| Task Achievement / Task Response | 5.0 |
| Coherence and Cohesion | 5.5 |
| Lexical Resource | 5.0 |
| Grammatical Range and Accuracy | 5.0 |
| Overall | 5.0 |
Task Achievement / Task Response: Band 5.0
You identify the chart’s subject and report several relevant figures, including the male peak of 52.8% among 15–24-year-olds and the female peak of 53.3% among 45–54-year-olds. However, the overview is unclear and does not summarise the main pattern: men were higher only in the youngest group, while women exceeded men in every other age group. Some details are inaccurate: the male figure for those aged 65 and over is 46.7%, not 46.1%, and the statement that older people are more health-oriented is an unsupported explanation. The response also gives figures without consistently explaining the comparisons or trends. Make the overview precise, select the key contrasts, and report values accurately without adding causes the chart cannot establish.
Coherence and Cohesion: Band 5.5
The response has a recognisable paragraph structure, with an introduction, an overview, and separate sections for men and women. This gives the reader a basic route through the information. However, progression within paragraphs is often difficult to follow: the male paragraph moves from a trend to “youngsters,” “adults,” and “elderly peoples” without clearly linking each label to an age group or comparison. Connectors such as “Moreover,” “additionally,” and “Lastly” are used mechanically and do not always show a meaningful relationship between points. The overview also repeats the idea of different percentages rather than guiding the reader through the main pattern. Grouping the data by gender or by the contrast between the sexes, and using clearer references, would make the account more coherent.
Lexical Resource: Band 5.0
You use some relevant chart vocabulary, including “proportion,” “declined,” “percentage,” and “age group,” so the topic is generally recognisable. However, the range is limited and several word choices or collocations make the meaning awkward: “punctaul in regular activities,” “massive,” “middle proprtion in manageable adult females,” and “oriented about health” are not suitable descriptions of these data. There are also spelling errors, such as “flactuating” and “proprtion,” and repeated use of broad labels such as “peoples.” Choose precise terms for describing figures and trends, and avoid evaluative or explanatory language. For example, “the highest proportion” and “the figure fluctuated” would communicate the chart information more naturally.
Grammatical Range and Accuracy: Band 5.0
You attempt both simple statements and longer sentences, but control is inconsistent, and errors frequently make relationships between ideas unclear. Examples include “the proportion of men and women in Australian has different age group,” “the males has increased,” and “the 53.3% is massive and lowest is 47.1%.” These show problems with agreement, articles, sentence construction, and comparison structures. Some sentences also combine several points without a clear grammatical link, as in the male paragraph beginning “However, the youngsters ratio is 42.2% moreover…”. Use straightforward, complete sentences as a foundation, checking subject–verb agreement and singular/plural forms. Then add a small number of controlled complex sentences to compare the two groups and describe changes across ages.
See this exact question answered at other band scores. The same prompt compared across bands.
Browse more IELTS Writing model answers or get your own writing scored by the same AI examiner.