Band 5.5 IELTS Writing Task 1 Model Answer
Overall Band Score: 5.5 · Cambridge IELTS 12 · 2026-11-11
IELTS Writing Task 1 question
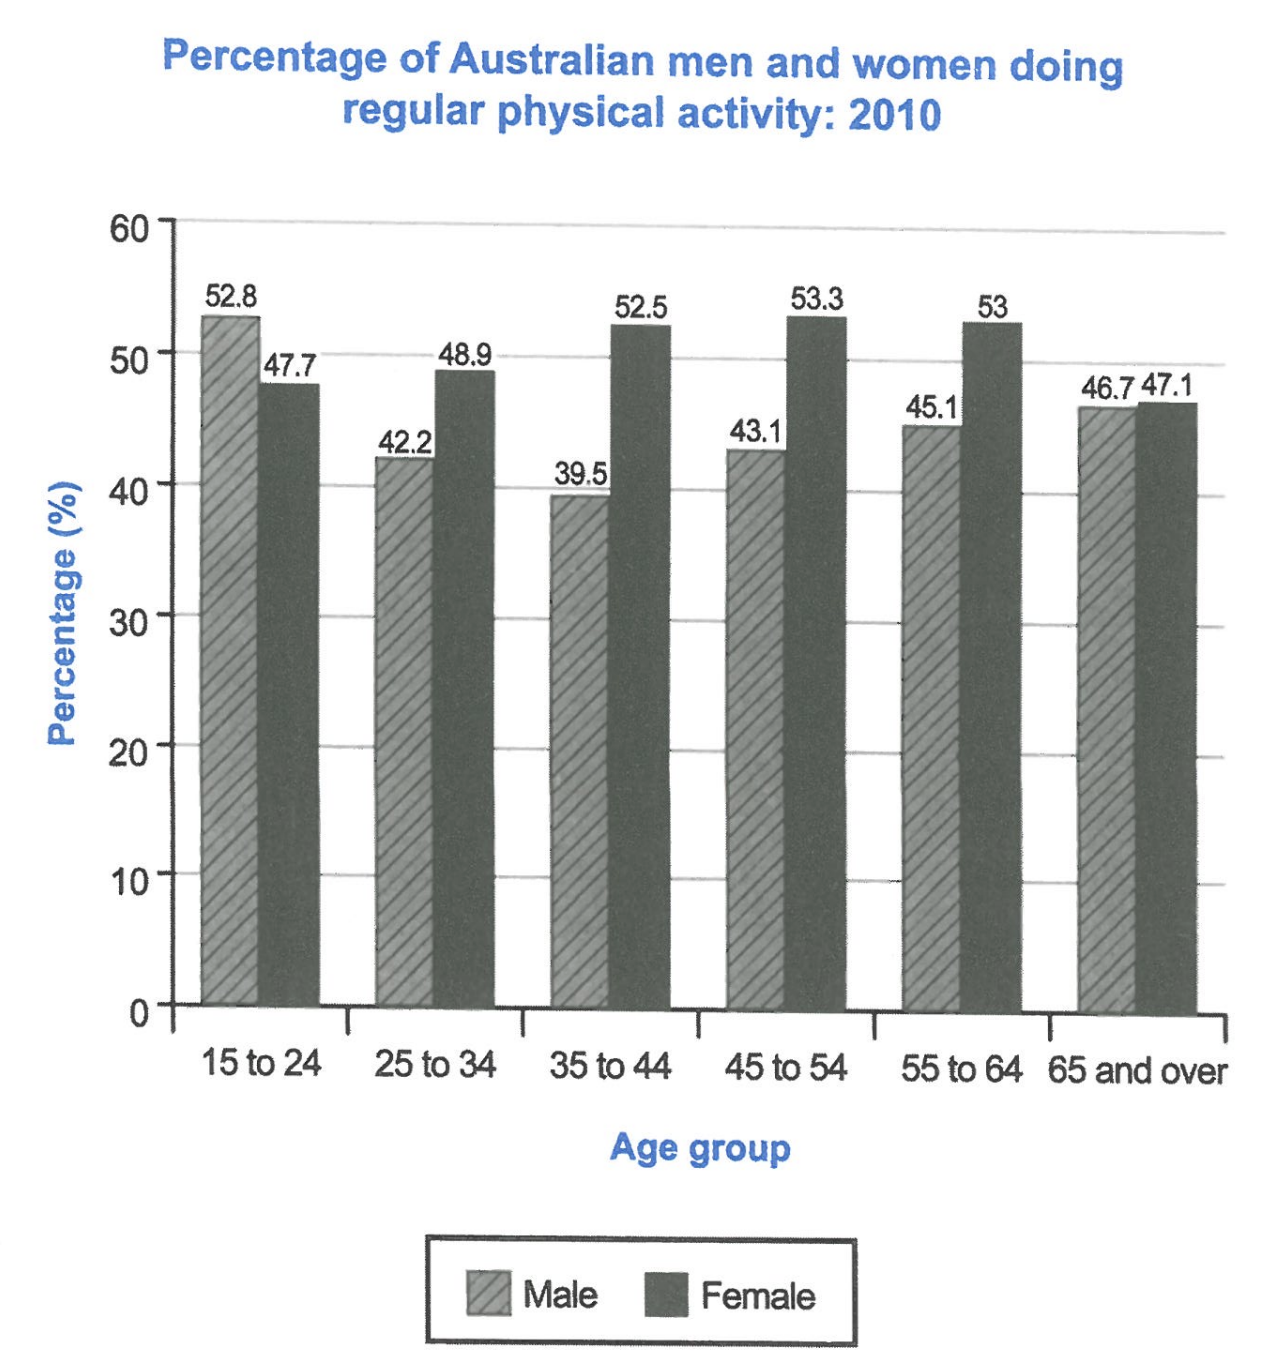
The bar chart below shows the percentage of Australian men and women in different age groups who did regular physical activity in 2010.
Summarise the information by selecting and reporting the main features, and make comparisons where relevant.
Student answer (Band 5.5)
The graph depicts the percentage of Eustralian male and female individuals in different age groups who often did physical activity in 2010.Overall, the rate of female physical activity was high in most age groups than the the male persons.Notably, the younger males people were active more than the female individuals.Units are in percentage.
To start with, more women between the ages of 45 to 54 were more active as the recorded a total of 53.3 percent amd closely followed by the age group 55 to 64 with 53.Females at the age of 35 to 44 had a total of 52.5 who participated in regular activities.The percentage reduced to 48.9 for the age of 25 to 34.Young adults of 14 years to 24 tallied a 47.7 and the least was the older of 65 and over which recorded a percent of 47.1.
On the other hand, male of younger age of 15 to 24, were active.Theere total recordings was 52.8.The generation of 65 and above came in next with 47.1 total percentage of men who were active.55 to 64 and 45 to 54 Australia saw a percent of 45.1 and 43.1 respectively.Men in the age of 25 to 34 stood at 42.2 which was the second least and lastly, came the age group of 35 to 44 which was 39.5 percent male who were physically active.
AI examiner evaluation
| Criterion | Band |
|---|---|
| Task Achievement / Task Response | 6.0 |
| Coherence and Cohesion | 6.0 |
| Lexical Resource | 5.5 |
| Grammatical Range and Accuracy | 5.0 |
| Overall | 5.5 |
Task Achievement / Task Response: Band 6.0
You cover both sexes and all six age groups, and the figures are mostly reported accurately. The overview identifies the broad pattern that women were more active in most groups and that young men led their female counterparts. However, it would be clearer and more complete if it highlighted the key contrast: men’s rate fell to a low among those aged 35–44 before rising, while women’s rate peaked around ages 45–64. There is also a factual error: men aged 65 and over recorded 46.7%, not 47.1%; 47.1% is the female figure. The reference to “14 years to 24” is also inaccurate. More selective comparisons and a precise overview would make the main features clearer.
Coherence and Cohesion: Band 6.0
The response has a recognisable structure: an introduction and overview are followed by separate paragraphs for women and men. Phrases such as “To start with” and “On the other hand” help signal the shift between groups, and the figures within each paragraph generally follow an age-group sequence. However, the overview is compressed into several short statements, and the comparison between the sexes is not developed beyond the general claim that women were higher in most groups. Some linking is mechanical, while unclear phrasing such as “55 to 64 and 45 to 54 Australia saw” interrupts the flow. Organise the overview around the main trends, then use direct comparisons at matching ages to create a more continuous progression.
Lexical Resource: Band 5.5
You use relevant task vocabulary, including “percentage,” “recorded,” “participated,” and “physically active,” so the chart remains understandable. There is also some attempt to vary expressions for age groups. However, several choices are inaccurate or unnatural, such as “Eustralian,” “male persons,” “the older,” and “tallied a 47.7.” Repeated use of “total” and “active” also limits precision, and “often did physical activity” does not express the chart’s idea of regular activity naturally. Spelling slips such as “amd” and “Theere” further reduce control. Aim for standard chart language—“the proportion of Australian men,” “stood at,” and “those aged 65 and over”—rather than inventing varied but awkward phrases.
Grammatical Range and Accuracy: Band 5.0
You attempt both simple statements and longer comparative sentences, and the reader can usually understand the intended meaning. However, control is uneven: the opening overview contains the faulty comparison “high in most age groups than,” and “as the recorded a total” lacks a clear grammatical subject. Other problems include “male of younger age,” “Theere total recordings was,” and the sentence fragment-like construction “55 to 64 and 45 to 54 Australia saw a percent.” Punctuation is also inconsistent, with missing spaces after full stops and several run-on sequences. Use complete subject–verb structures, check agreement and articles, and separate each comparison into a clearly punctuated sentence. More accurate complex sentences would improve clarity.
See this exact question answered at other band scores. The same prompt compared across bands.
Browse more IELTS Writing model answers or get your own writing scored by the same AI examiner.