Band 5.5 IELTS Writing Task 1 Model Answer
Overall Band Score: 5.5 · Cambridge IELTS 12 · 2026-11-11
IELTS Writing Task 1 question
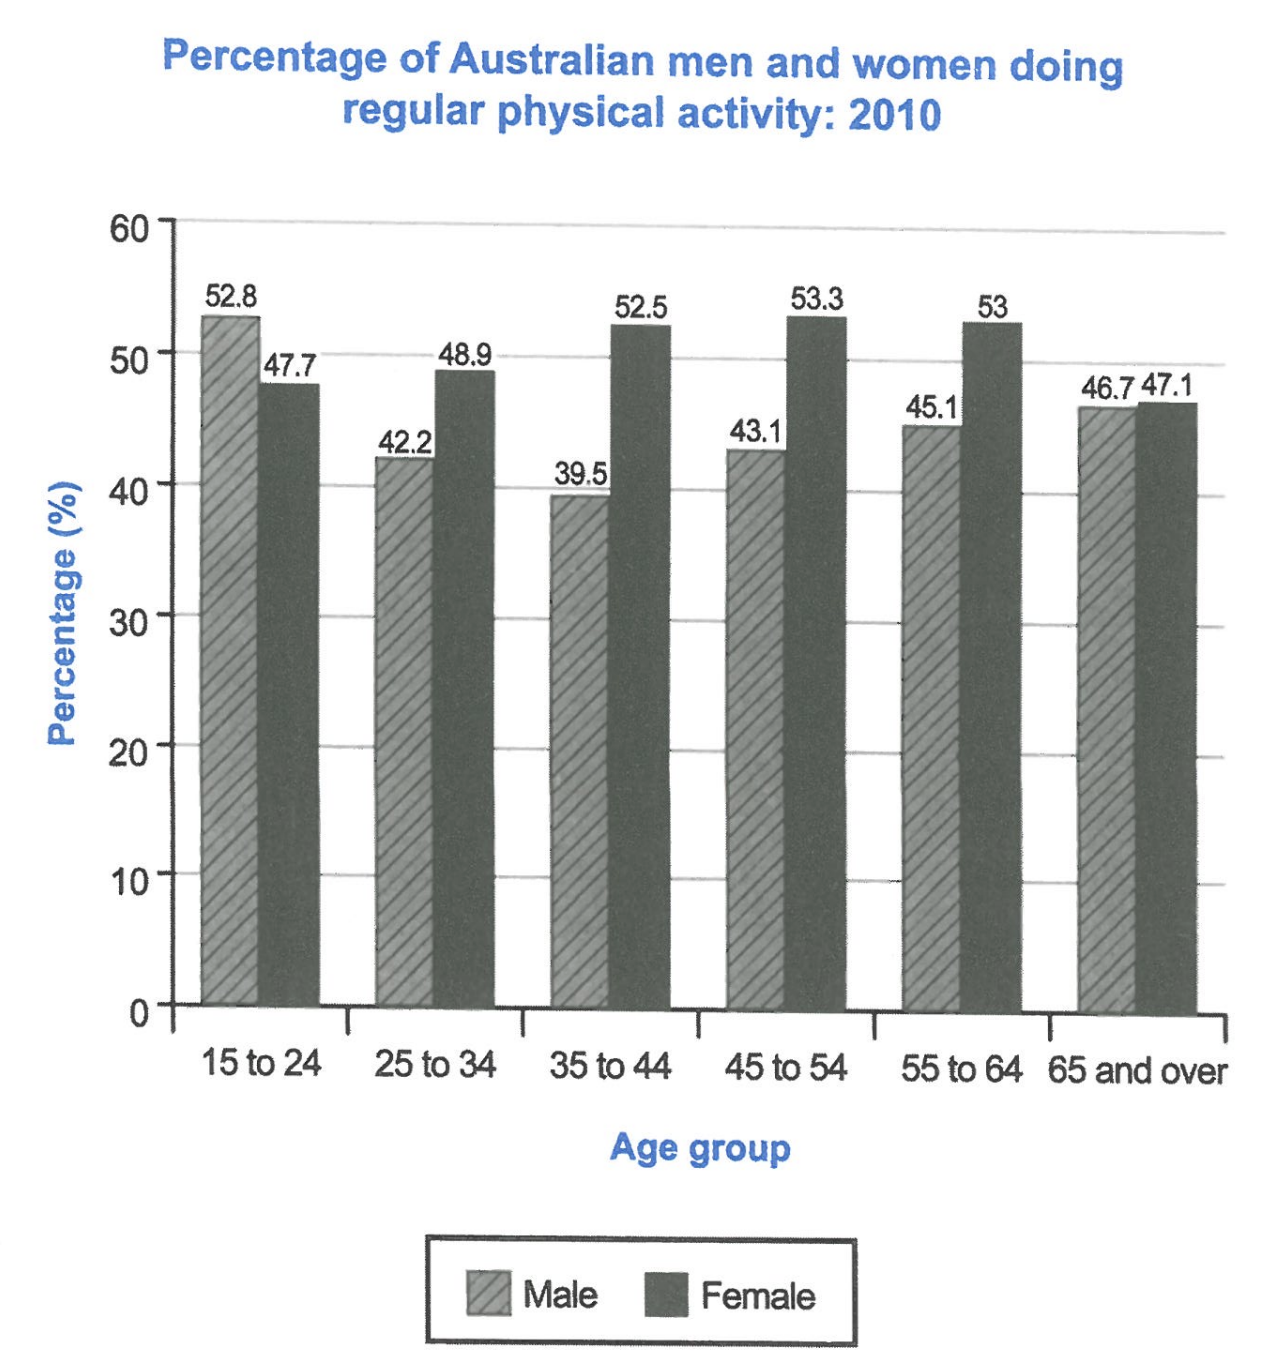
The bar chart below shows the percentage of Australian men and women in different age groups who did regular physical activity in 2010.
Summarise the information by selecting and reporting the main features, and make comparisons where relevant.
Student answer (Band 5.5)
The bar chart illustrates the gender based percentage of Australian population in various age groups who performed physical exercise regularly in 2010.
Overall chart demonstrates the increased percentage of physicall activity of the males of age group 15 to 24 and showed gradual decrease in the age group 25 to 34 and again rose steadily till the age of 65 and over.The gragh presents that the female physical activity percentage considerably incline within the following years from 15 years to the age of 64 and decline slightly almost equal to male percentage.
52.5% in the age group 15 to 24 was the highest value recorded among the all age groups of male which is declined with slight fluctuations in the percentage among all age groups of male and become almost equale to female percentage in the age group 65 and over.
Female data showed increasing trend with the increasing age and remained higher to the figure of 52.5%, 53.3% and 53 % in the age groups 35 to 44, 45 to 54 and 55 to 64 respectively following a slight drop in % and became equal to male %.
AI examiner evaluation
| Criterion | Band |
|---|---|
| Task Achievement / Task Response | 6.0 |
| Coherence and Cohesion | 5.5 |
| Lexical Resource | 5.5 |
| Grammatical Range and Accuracy | 5.0 |
| Overall | 5.5 |
Task Achievement / Task Response: Band 6.0
You identify the chart’s subject and report several relevant comparisons, including the female figures for ages 35–44, 45–54 and 55–64. However, some key details are inaccurate: the highest male figure is 52.8% for ages 15–24, not 52.5%, and male activity does not decrease steadily after that point; it falls to 39.5% at ages 35–44 before rising. The overview also says male activity “increased” for the youngest group, which is unclear because the chart gives a single-year snapshot rather than a change over time. Your account covers the main patterns, but the overview and some comparisons need more precise interpretation and fuller reporting of the gender differences across age groups.
Coherence and Cohesion: Band 5.5
The response has a recognisable structure: an introduction, an overview and separate discussion of male and female figures. This helps the reader follow the broad subject. However, progression is weakened by unclear links between ideas and by some repetition, particularly the repeated statement that the figures become “almost equal” at age 65 and over. The overview combines several trends in long sentences, making the main message difficult to identify. Punctuation and spacing also interrupt the flow, as in “65 and over.The” and the extra gaps before phrases. Use clearer paragraphing and organise the body around the main comparison—for example, men’s higher rate in the youngest group versus women’s higher rates in most other groups—then support it with selected figures.
Lexical Resource: Band 5.5
You use relevant chart vocabulary such as “percentage,” “age group,” “increasing trend” and “slight drop,” so the topic is generally clear. However, several word choices and collocations are inaccurate or awkward, including “gender based percentage of Australian population,” “percentage of physicall activity,” and “incline within the following years.” “Fluctuations” is also not quite suitable for describing the male pattern, which falls and then rises across age categories. Spelling errors such as “physicall,” “gragh” and “equale” reduce accuracy. Aim for concise, conventional language for describing data, and check spelling and word forms carefully. More precise terms would make your comparisons clearer without requiring more complicated vocabulary.
Grammatical Range and Accuracy: Band 5.0
You attempt both simple and more complex sentences, including clauses linked with “which” and “and,” but control is uneven. For example, “Overall chart demonstrates” is missing an article, while “52.5% … was the highest value … which is declined” has an incorrect relative-clause construction and tense. The sentence beginning “Female data showed increasing trend” also needs an article, and its final clause does not clearly connect the comparison to the subject. Several sentences run together without full stops, which makes grammatical relationships harder to follow. Practise building shorter, accurate comparison sentences first, then combine them with controlled clauses. Check articles, verb forms and punctuation during revision.
See this exact question answered at other band scores. The same prompt compared across bands.
Browse more IELTS Writing model answers or get your own writing scored by the same AI examiner.