Band 5.0 IELTS Writing Task 1 Model Answer
Overall Band Score: 5.0 · Cambridge IELTS 12 · 2026-11-11
IELTS Writing Task 1 question
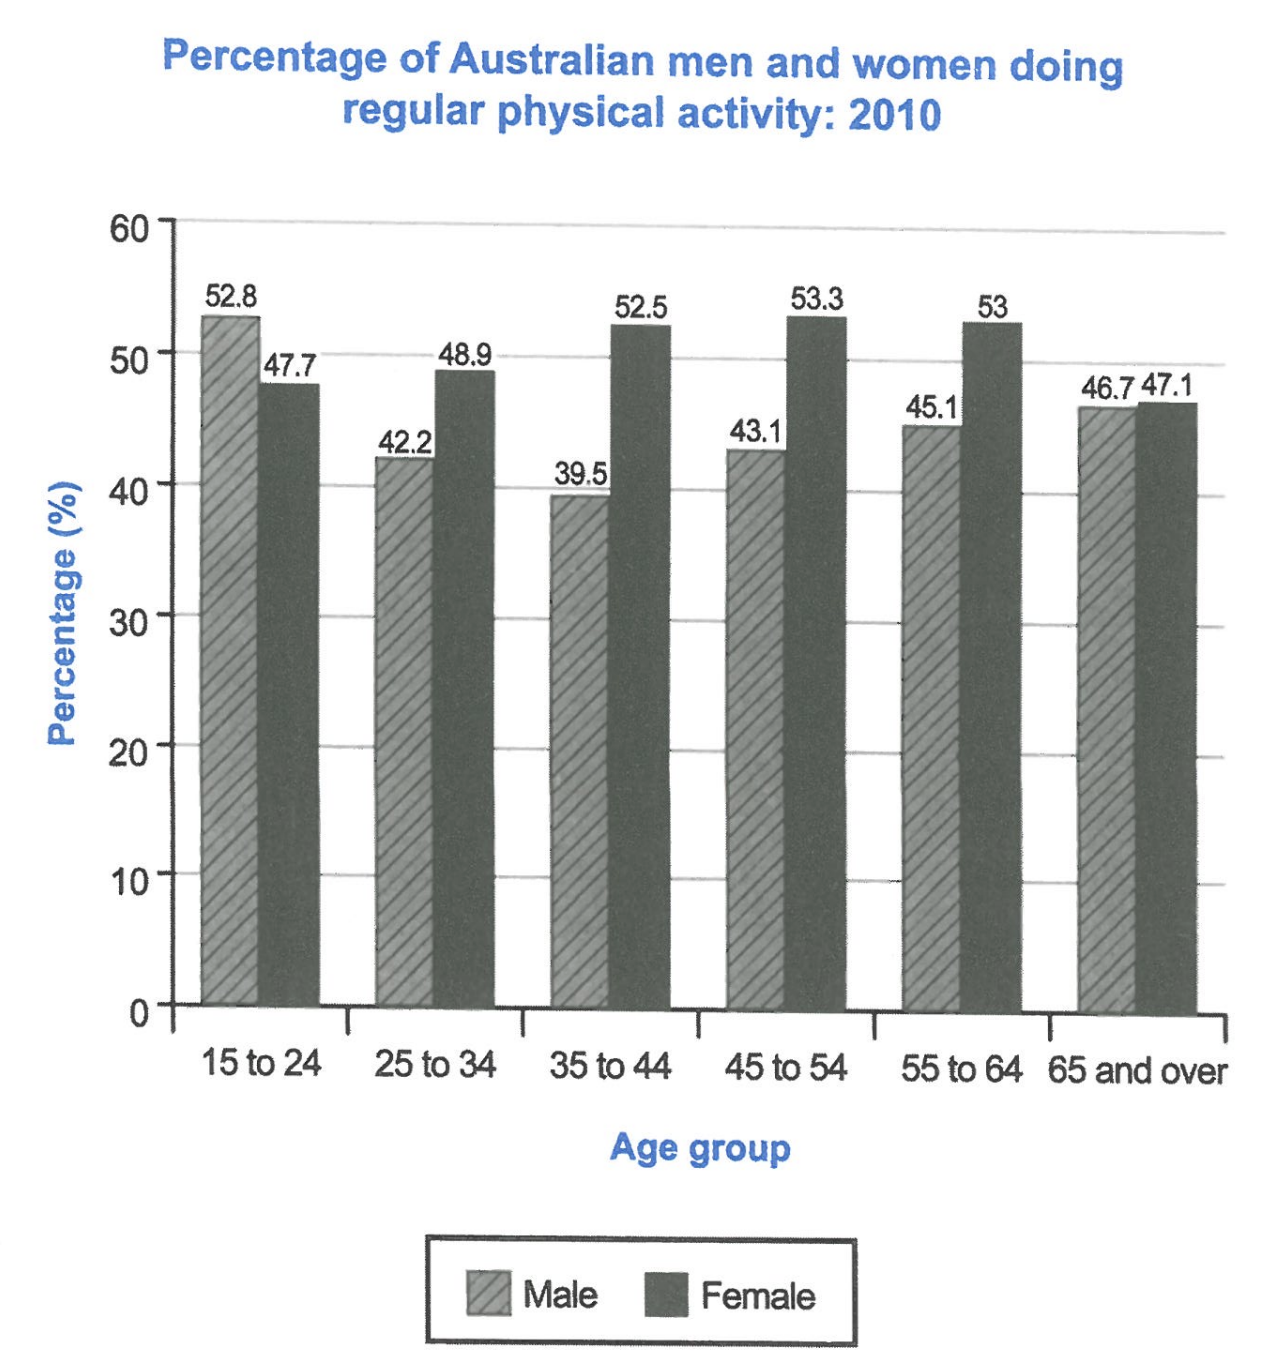
The bar chart below shows the percentage of Australian men and women in different age groups who did regular physical activity in 2010.
Summarise the information by selecting and reporting the main features, and make comparisons where relevant.
Student answer (Band 5.0)
The above bar chart illustrates the percentage of the Australian men and women in different age groups who did regular physical activity in 2010.
The women of 45 to 54 age group people have the highest percentage compared to other age groups.The remaining age group 15 to 24 has highest percentage 52.8 for male.After comparing overall age groups females have highest percentage and they were higher in each and every group except 15 to 24 age group because in this age group male has dominated the female gender.
As the given picture shows that the 15 to 24 age group have 52.8 percentage of male and 47.7 percentage of female overall here male gender has highest percentage in physical activity.Next 25 to 34 age group people have 42.2 percentage of male and 48.9 percentage of female and here female age(25-34) group people have dominated the male(25-34) group people.Next 35 to 44 age group people have 39.5 percentage of male and 52.5 percentage of female and here also female age group has the highest highest percentage than male age group people.Next 43.1% of male and 53.3% of female age group people were there in 45 to 54 age, here also female age group people have the majority.In next 55 to 64 age group people have 45.1% of male and 53% of female aged group people and here also female age group dominated.The last 65 and over aged group have 46.7% of male and 47.1% of female age group people.Here also we can observe that female aged group ahve highest than male age group people.
So by using above information we can conclude that female have higher percentage and they have done physical activities regularly than male age group people(25-34).
AI examiner evaluation
| Criterion | Band |
|---|---|
| Task Achievement / Task Response | 5.5 |
| Coherence and Cohesion | 4.5 |
| Lexical Resource | 5.0 |
| Grammatical Range and Accuracy | 5.0 |
| Overall | 5.0 |
Task Achievement / Task Response: Band 5.5
You identify the main broad pattern: women recorded higher participation in every age group except 15–24, and you include figures for all six groups. Most figures are accurate. However, the overview is not fully reliable: you call 45–54 the women’s highest group, although the peak is 45–54 at 53.3%, only slightly above 55–64 at 53.0%; more importantly, the opening says the 15–24 group has the highest male figure, which is correct, but the overview does not clearly summarise the contrasting trends across ages. The conclusion also narrows the comparison oddly to women aged 25–34. Select the key peaks and lows and describe the overall pattern more precisely, rather than repeating each pair of figures.
Coherence and Cohesion: Band 4.5
The response has an opening, a broad overview, a sequence of age-group comparisons, and a concluding sentence, so the reader can identify its general subject. However, progression is repetitive and sometimes difficult to follow. The overview repeats information that is then restated in detail, while phrases such as “Next,” “here also,” and “in next” connect nearly every sentence in the same mechanical way. The long body paragraph contains all six groups without a clear grouping or contrast, and the conclusion repeats the claim that women are higher. Organise the details into two logical groups, such as younger versus older ages, and use fewer, more precise linking expressions and clear references.
Lexical Resource: Band 5.0
You use relevant chart vocabulary, including “percentage,” “age group,” “physical activity,” and “compared,” which makes the topic clear. However, the range is limited and several expressions are repetitive or unnatural, such as “female age group people,” “dominated the male group people,” and “have the majority.” “Highest highest” is also an unnecessary repetition, and “male gender” and “female gender” are less suitable than “men” and “women” when describing chart categories. These choices sometimes make the comparisons awkward to read. Aim for concise, accurate reporting language and vary verbs such as “stood at,” “was higher than,” and “peaked at.”
Grammatical Range and Accuracy: Band 5.0
The response attempts both simple statements and longer sentences with comparisons, and the reader can generally understand the intended figures. However, the range is limited, and errors occur frequently in sentence construction and agreement. For example, “The women of 45 to 54 age group people have” has an awkward noun structure, while “the 15 to 24 age group have 52.8 percentage” has subject–verb agreement and article problems. Several sentences run together without appropriate punctuation, including the opening overview and the sequence beginning “Next 25 to 34 age group.” Use a consistent past-tense reporting pattern, check singular and plural subjects, and separate each comparison into a complete, correctly punctuated sentence.
See this exact question answered at other band scores. The same prompt compared across bands.
Browse more IELTS Writing model answers or get your own writing scored by the same AI examiner.