Band 5.0 IELTS Writing Task 1 Model Answer
Overall Band Score: 5.0 · Cambridge IELTS 12 · 2026-11-12
IELTS Writing Task 1 question
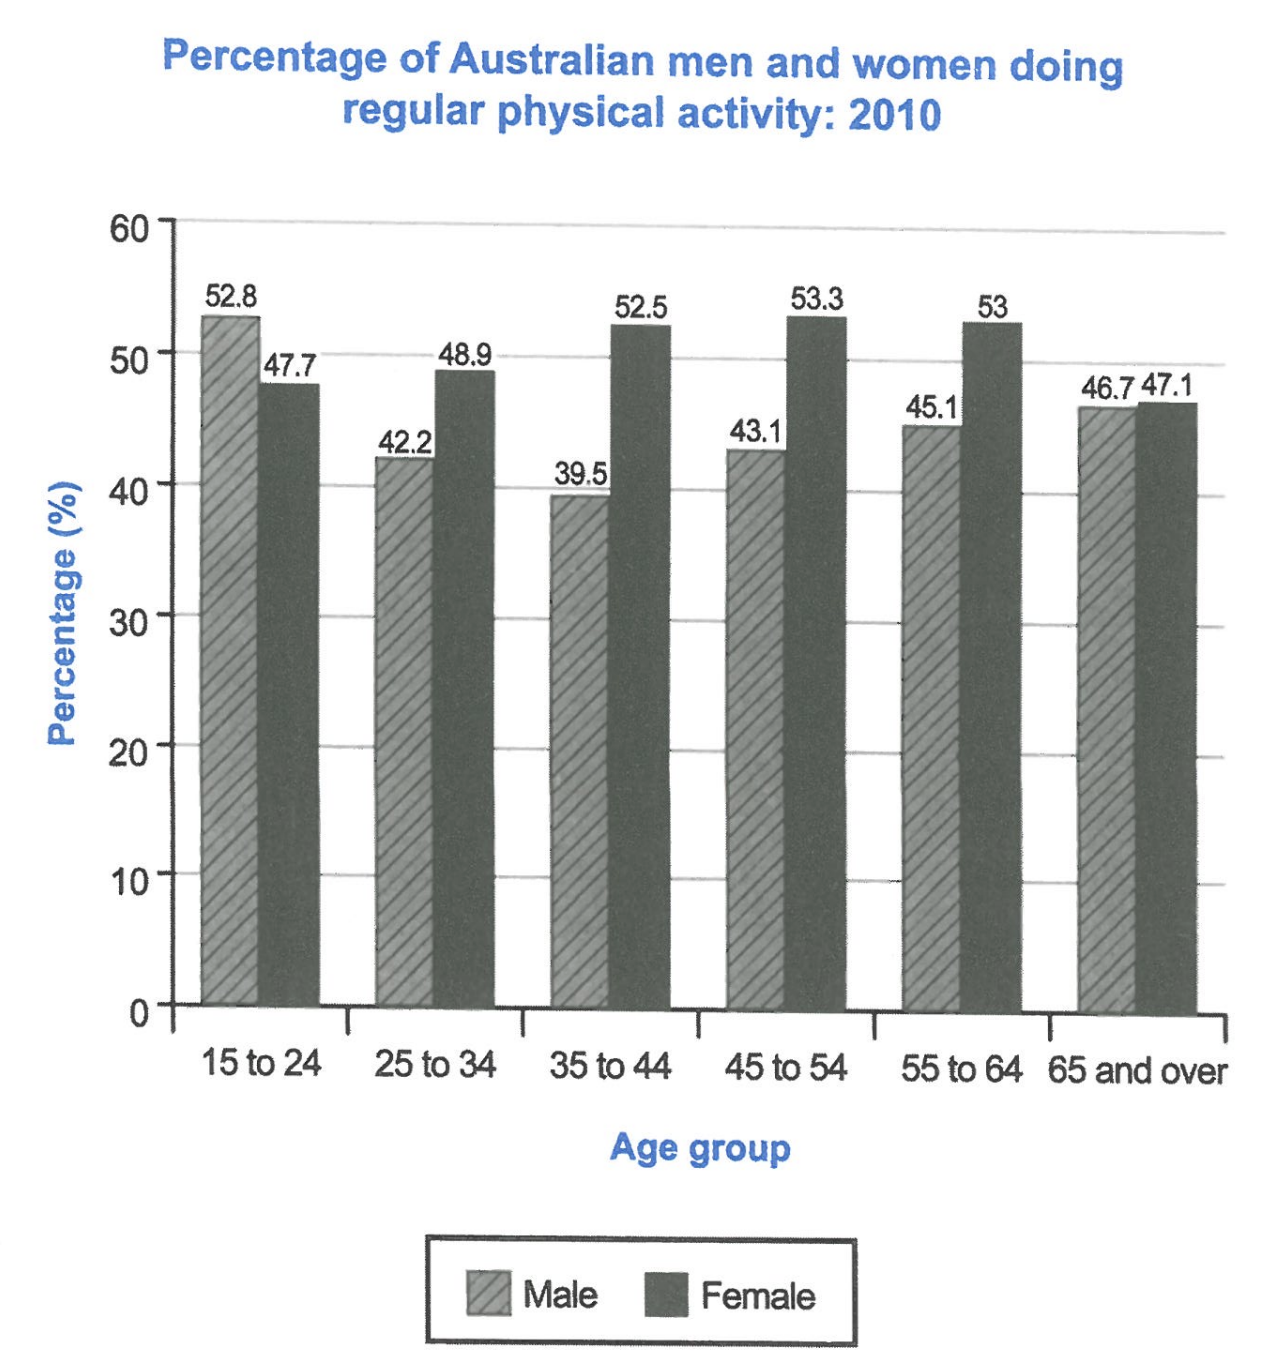
The bar chart below shows the percentage of Australian men and women in different age groups who did regular physical activity in 2010.
Summarise the information by selecting and reporting the main features, and make comparisons where relevant.
Student answer (Band 5.0)
The given bar chart provides information about percentage of Australian individuals as like male or women daily physical activity in the year of 2010.
Overall, it is crystal clear that the highest percentage of daily activity was done by women or lowest percentage of everyday activity done by female.
To begin with, at the age group of 15 to 24, 52.8 percent males were do regular physical exercise, or this age the percentage of females was 47.7, as well as at the age group of 25 to 34 the percentage of males was 42.2 who were do daily exercise. While, the percentage of women was 48.9. Furthermore, at the age of 35 to 44 the percentage of daily activity of male was 39.5 percentage or the percentage of female was 52.5.
Moreover, at the age of 45 to 54 the men was doing the daily activity, their percentage was 43.1 or the percentage of women was 53.3. Additionally, in the age of 55 to 64 the men was doing regular exercise, or their percentage was 45.1 as well as female percentage of daily exercise was 53 percent. In addition in the age of 65 or above men or women doing same percentage of regular physical activity, because their percentage have no more difference, as well as the percentage of male was 46.7 or female percentage was 47.1.
AI examiner evaluation
| Criterion | Band |
|---|---|
| Task Achievement / Task Response | 4.5 |
| Coherence and Cohesion | 5.5 |
| Lexical Resource | 5.0 |
| Grammatical Range and Accuracy | 5.0 |
| Overall | 5.0 |
Task Achievement / Task Response: Band 4.5
You include figures for all six age groups and make relevant male–female comparisons, so the response is recognisably about the chart. However, the overview is unclear and internally contradictory: it says women had both the “highest” and “lowest” activity, without identifying the age groups or the overall pattern. The chart shows men were more active only among 15–24-year-olds, while women had higher rates in every other group; women peaked at 45–54 and men reached their low at 35–44. These key features are not clearly summarised. Some details are also inaccurate: the chart reports regular activity, not daily activity, and the final group is described as having the “same” rate despite a small difference. A concise, accurate overview of the main trends would strengthen the report.
Coherence and Cohesion: Band 5.5
The response has a basic structure: an introduction, an attempted overview, and a sequence of details by age group. This makes the information possible to follow, and the age groups are presented in chart order. However, progression is weakened by the repeated pattern of “at the age group…” followed by “as well as” or “or,” which often does not express the intended comparison clearly. The overview’s contradictory statement also disrupts the reader’s understanding of the main message. Paragraphing the overview separately from the detailed comparisons, and grouping the age groups where women exceed men, would create a clearer progression. Use linking expressions selectively and make sure each one accurately signals contrast or addition.
Lexical Resource: Band 5.0
You use some relevant chart vocabulary, including “percentage,” “age group,” and “regular physical activity,” and the figures are generally expressed in an understandable way. However, the range is limited and several phrases are awkward or imprecise, such as “individuals as like male or women,” “daily activity,” and “the men was doing the daily activity.” Repeating “percentage” and “doing” also makes the report less natural. In this task, “regular physical activity” should be used consistently rather than “daily exercise,” since the chart does not specify daily activity. Build a more precise range for describing data, such as “the proportion of men,” “exceeded,” “peaked at,” and “declined,” while checking that each expression matches the figures.
Grammatical Range and Accuracy: Band 5.0
The response attempts longer sentences and uses some linking clauses, but grammatical control is inconsistent. Errors in verb forms and agreement occur in phrases such as “52.8 percent males were do” and “the men was doing”; these should use a correctly formed past-tense verb, for example, “52.8% of men did regular exercise.” Articles and sentence construction are also problematic in “at the age group of 15 to 24” and in the fragment-like transition “While, the percentage of women was 48.9.” Several sentences join comparisons with “or” where a complete contrast structure is needed. Use a mix of shorter accurate sentences and controlled complex comparisons, and check subject–verb agreement, verb forms, and punctuation before submitting.
See this exact question answered at other band scores. The same prompt compared across bands.
Browse more IELTS Writing model answers or get your own writing scored by the same AI examiner.