Band 5.0 IELTS Writing Task 1 Model Answer
Overall Band Score: 5.0 · Cambridge IELTS 12 · 2026-11-12
IELTS Writing Task 1 question
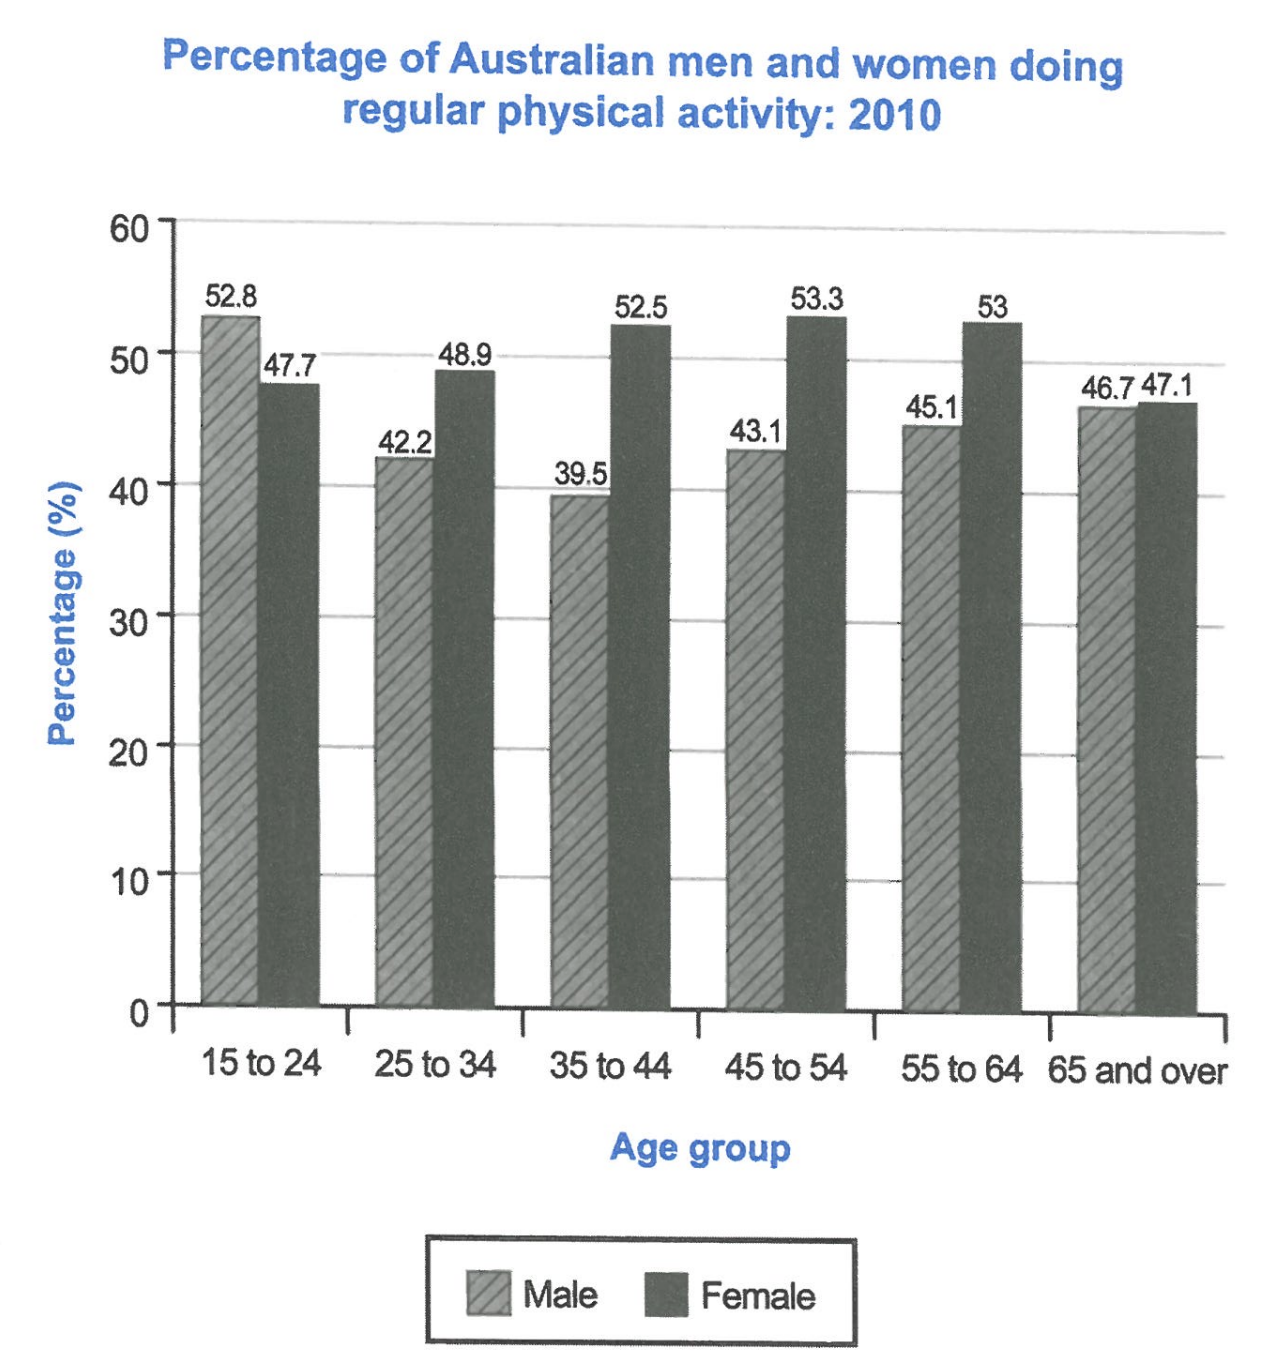
The bar chart below shows the percentage of Australian men and women in different age groups who did regular physical activity in 2010.
Summarise the information by selecting and reporting the main features, and make comparisons where relevant.
Student answer (Band 5.0)
The bar chart illusrtrate the ratio of Australian men and women in various age groups who did daily physical activity in 2010.
Overall, in this chart they tell the percentage of both men and women. In 2010, the highest amount men and women that did exercise regularly was 53.3. This amount consist on 54 years old womens. In addition, the lowest amount of citizens was 39.5 that was about 35 years old men.
In 2010, the percentage of people was 52.8 that was around 15 years old after that the ratio of men decrease and stop at 42.2 in the age of 25. Following that, the ratio of men again decrease and stuck at 39.5 in the age of 35 and amount of 65 years old men was 46.7.
On the other side, the fraction of women in starting age of 24 was about 47.7 and the shae of women increase to 48.9 in the age of 34 and the over age women who did actvity regularly was about 47.1 percent.
AI examiner evaluation
| Criterion | Band |
|---|---|
| Task Achievement / Task Response | 5.0 |
| Coherence and Cohesion | 5.5 |
| Lexical Resource | 5.0 |
| Grammatical Range and Accuracy | 5.0 |
| Overall | 5.0 |
Task Achievement / Task Response: Band 5.0
You identify relevant extremes: the highest figure is 53.3% for women aged 45–54, and the lowest is 39.5% for men aged 35–44. You also describe the broad fall and recovery in the male figures. However, the overview is unclear and does not capture the main comparison that women were more active than men in every age group except 15–24. Several details are inaccurate or incomplete: 53.3% is attributed to women aged 54 rather than the 45–54 group, and the account omits the women’s peak-age figures and most comparisons between the sexes. Report the age bands precisely and select the key trends, including the crossover between male and female rates, to address the chart more fully.
Coherence and Cohesion: Band 5.5
The response has a basic paragraph structure, moving from an introduction and overview to separate descriptions of men and women. This gives the reader some organisation, and phrases such as “On the other side” signal a shift in focus. However, progression within paragraphs is sometimes difficult to follow: the overview repeats that the chart shows percentages without summarising the central pattern, while the male paragraph jumps from the youngest group to later ages and leaves the 45–54 and 55–64 figures unexplained. Linking expressions such as “after that” and “Following that” are repetitive and do not always clarify the sequence. Organise the body by comparing both sexes within age groups or by clearly tracing each series from youngest to oldest.
Lexical Resource: Band 5.0
You use some task-related vocabulary, including “percentage,” “ratio,” “fraction,” “decrease,” and “increase,” so the reader can generally recognise that the response describes chart data. However, the range is limited and several choices are inaccurate or unnatural for this task. “The highest amount” and “the lowest amount of citizens” do not describe percentages appropriately, while “stuck at” is too informal for reporting a figure. There are also spelling errors, including “illusrtrate,” “shae,” and “actvity,” which reduce clarity. Use precise chart language consistently, such as “proportion,” “rate,” “rose,” and “fell,” and check spelling and collocations before submitting.
Grammatical Range and Accuracy: Band 5.0
You attempt both simple and longer sentences, but control is inconsistent, and errors sometimes make relationships between figures unclear. For example, “the highest amount men and women that did exercise regularly was 53.3” is missing grammatical elements, and “This amount consist on 54 years old womens” has problems with verb form, preposition, and sentence construction. In “the percentage of people was 52.8 that was around 15 years old,” the clause structure obscures what the figure refers to. Subject–verb agreement and tense also need attention, as in “the ratio of men decrease.” Practise accurate comparative sentences with a clear subject, verb, age group, and percentage; simpler, well-controlled structures will make the data easier to understand.
See this exact question answered at other band scores. The same prompt compared across bands.
Browse more IELTS Writing model answers or get your own writing scored by the same AI examiner.