Band 6.0 IELTS Writing Task 1 Model Answer
Overall Band Score: 6.0 · Cambridge IELTS 12 · 2026-11-12
IELTS Writing Task 1 question
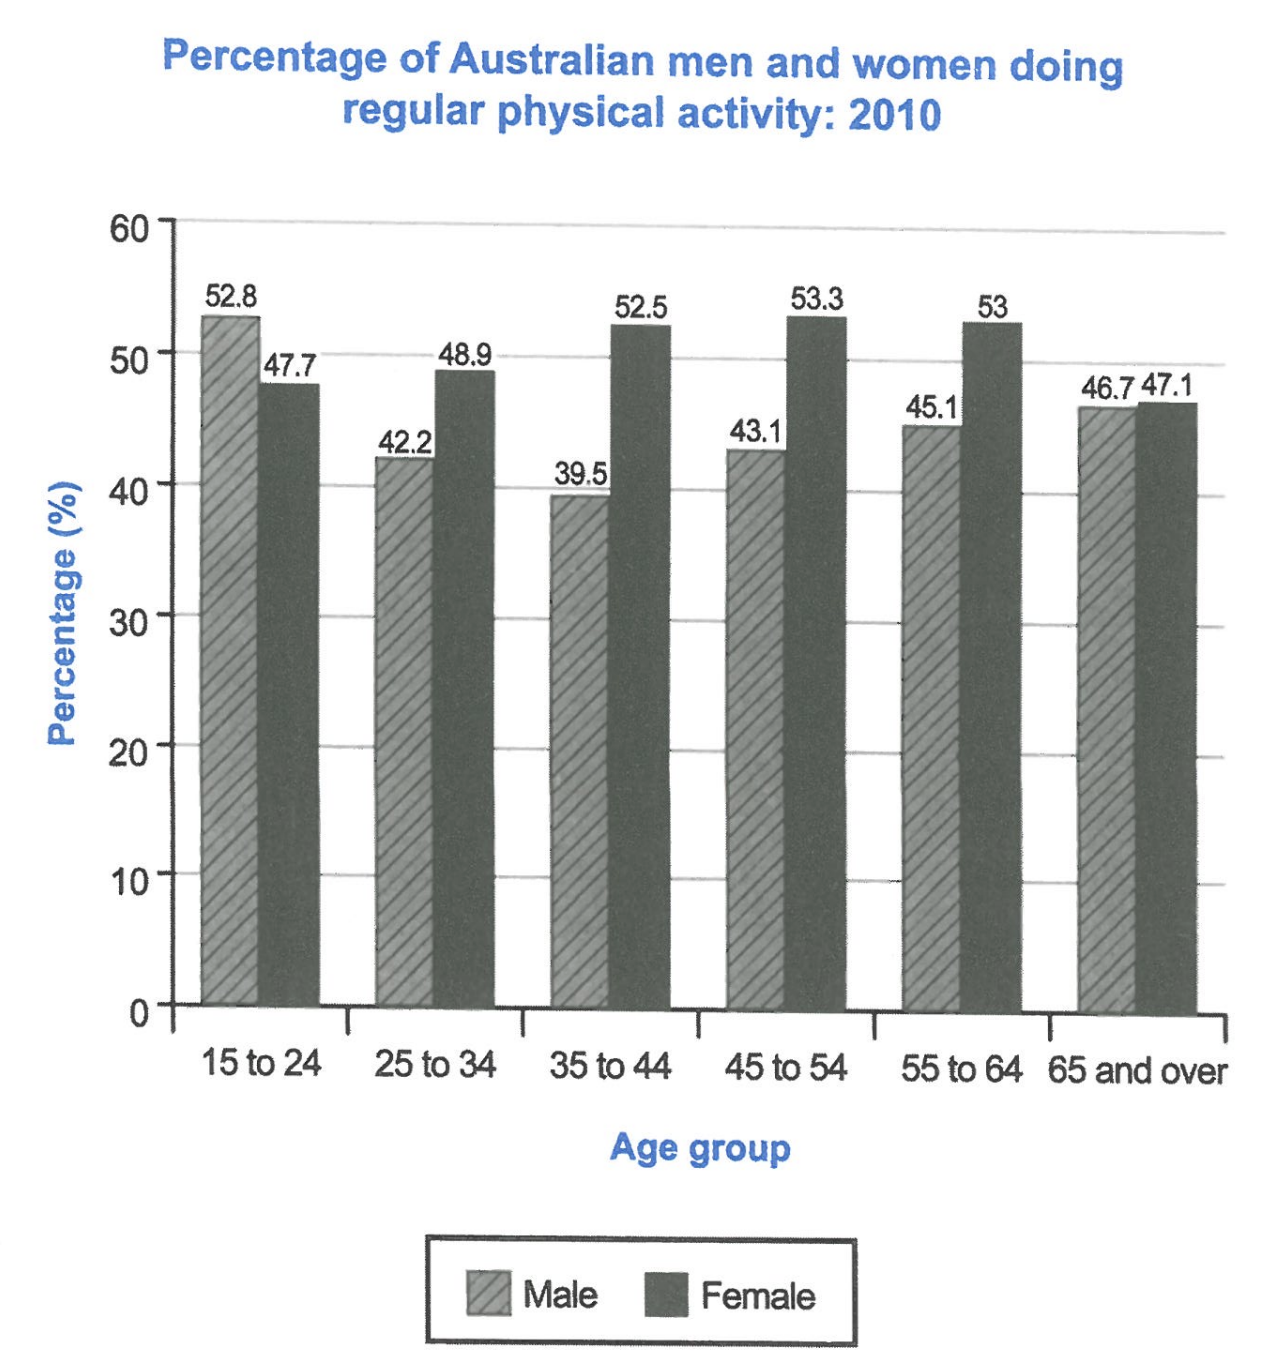
The bar chart below shows the percentage of Australian men and women in different age groups who did regular physical activity in 2010.
Summarise the information by selecting and reporting the main features, and make comparisons where relevant.
Student answer (Band 6.0)
The bar chart illustrates the data percentage of Australian men and women who exercised regularly and they are separated by their age.
The chart showed that the highest people who did regular physical activity were the younger people, aged between 15 to 24 years in contrast the lower number of people that were involved with physical activities were seen among the above 65 years old group.
we can see that, among the 15 to 24 years age group people physical activity were more seen in the male than the female, which was 52.8%. Though it started to decline in 25 years of age among the male population. In contrast to that the female started to rise the percentage of physical activity gradually. We can see that among the 25 to 35 years of age females are more inclined to physical activity than the male, which was 48.9%. It kept increasing with age upto 64 years of people's group. Then there's a sudden drop of physical activities were seen in female population in 65 years and above, which was 47.1% though it was slightly higher than the male, which was 46.7%.
In conclusion it can be said that females were more engaged with regular physical activity than the males. Though the males started with higher numbers the females took the position and kept it until the age of 65 years of age.
AI examiner evaluation
| Criterion | Band |
|---|---|
| Task Achievement / Task Response | 6.0 |
| Coherence and Cohesion | 6.0 |
| Lexical Resource | 6.0 |
| Grammatical Range and Accuracy | 5.5 |
| Overall | 6.0 |
Task Achievement / Task Response: Band 6.0
You identify the chart’s broad pattern: men lead in the youngest group, while women have higher figures across the middle age groups, and you include several accurate values, such as 52.8% for young men and 48.9% for women aged 25–34. However, the overview is not fully accurate: the highest female rate is among 45–54-year-olds (53.3%), not the youngest group, and the lowest overall figure is men aged 35–44 (39.5%), rather than the oldest group. The conclusion that women were more active overall is also too broad, since men lead at 15–24 and women lead in the other five groups. A clearer overview and more precise comparisons would make the key features better developed.
Coherence and Cohesion: Band 6.0
The response has a recognisable structure, moving from an introduction to an overview, age-group comparisons and a conclusion. This gives the reader a coherent overall arrangement. Some linking is effective, particularly the contrast between men’s decline and women’s rise, and the use of “In contrast” helps signal the comparison. However, the progression is occasionally unclear: the overview focuses on youngest versus oldest groups, while the body shifts to trends without systematically comparing all age bands. Connectors such as “Though” and “Then” sometimes make relationships between ideas feel abrupt, and “we can see” is repeated. Organising the body around the male and female trends, with clear comparisons at each stage, would improve cohesion and progression.
Lexical Resource: Band 6.0
You use an adequate range of task-related vocabulary, including “decline,” “gradually,” “inclined,” and “engaged,” and the reader can generally understand the comparisons. There are also attempts to avoid repeating “physical activity.” However, several expressions are imprecise or unnatural for describing chart data, such as “the highest people,” “lower number of people,” and “physical activity were more seen.” “Sudden drop” overstates the change in the female figure from 53.0% to 47.1%, while “took the position” is vague. Choose precise terms for percentages and trends, and use natural collocations such as “the proportion of women” and “the rate fell.” This would make the description more accurate and fluent.
Grammatical Range and Accuracy: Band 5.5
You attempt a mix of simple and complex sentences, including contrast clauses with “Though” and “In contrast,” and most of the intended meaning remains understandable. However, some grammatical errors recur. For example, “The chart showed” shifts tense unnecessarily from the present-tense introduction, and “among the 15 to 24 years age group people physical activity were more seen” has problems with word order, agreement and sentence structure. In “a sudden drop of physical activities were seen,” the subject and verb do not agree, and “upto 64 years of people's group” has an unclear grammatical construction. Use consistent present tense for chart descriptions, check subject–verb agreement, and simplify sentences when several clauses make the structure difficult to control.
See this exact question answered at other band scores. The same prompt compared across bands.
Browse more IELTS Writing model answers or get your own writing scored by the same AI examiner.