Band 5.5 IELTS Writing Task 1 Model Answer
Overall Band Score: 5.5 · Cambridge IELTS 12 · 2026-11-13
IELTS Writing Task 1 question
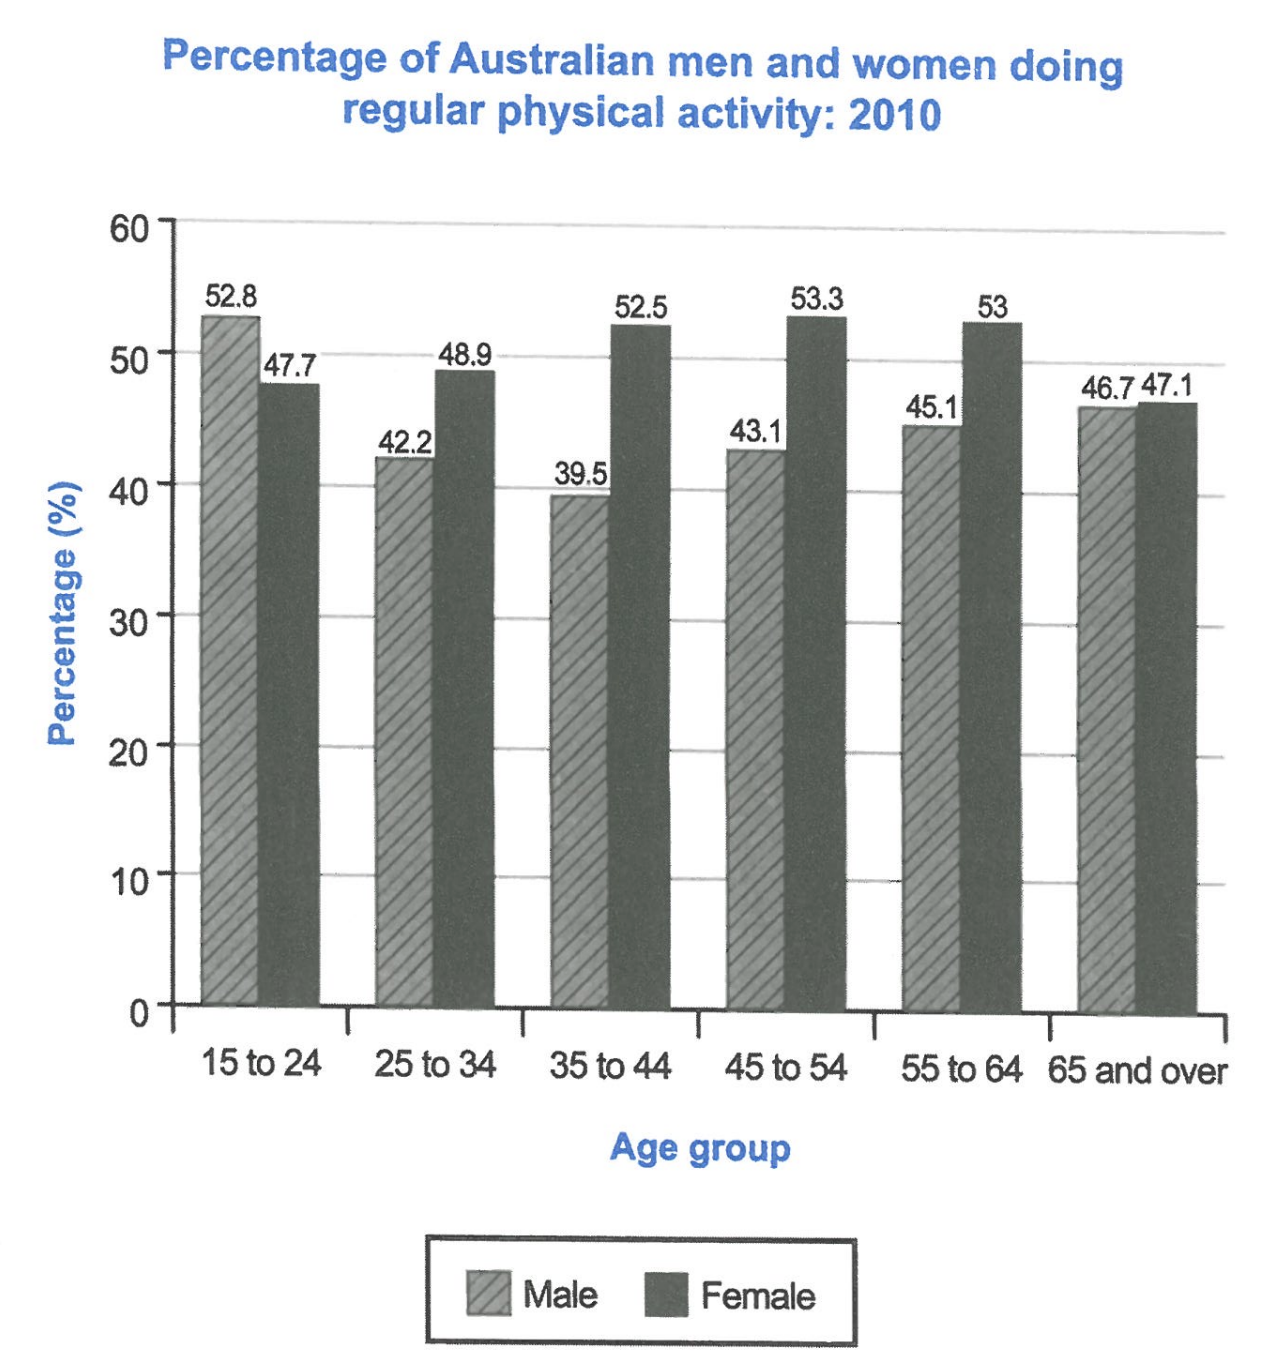
The bar chart below shows the percentage of Australian men and women in different age groups who did regular physical activity in 2010.
Summarise the information by selecting and reporting the main features, and make comparisons where relevant.
Student answer (Band 5.5)
The given bar chart elucidates information about the percentage of Australian men and women in different ages who did regular physical activity in 2010. The chart compares different catagories and presents the data in numbers and in the percentages for proper illustration.
Overall, it is evident that there are noticeable differences among the catagories shown in the chart, furthermore male and female in the age of 15 to 24 did physical activity regular is apeared to be the highest.,while the male and female of the 65 and over is apeared to be the lowest. in addition all catagories showed mixed results withe some fluctuation with stability, increment as well as decrement.
Talking about the age of male and female during 15 and 24 males percentages are 52.8% and womens percentage are 47.7% is apeared to be the highest and the second catagories in the age of 25 to 34 male have 42.2% and the women have 48.9% and the third catagories 35 to 44 age of man have 39.5% and the women have 52.5% and the forth catagories the age of 45 to 54 man have 43.1% and the women have 53.3% and in the second last catagorie the age of 55 to 64 the man have 45.1% and the women have 53% and in the last the man and woman have age 65 and over man have 46.7% and woman have 47.1% is apeared to be the lowest one who did the regular physical activity.
AI examiner evaluation
| Criterion | Band |
|---|---|
| Task Achievement / Task Response | 5.5 |
| Coherence and Cohesion | 5.5 |
| Lexical Resource | 5.5 |
| Grammatical Range and Accuracy | 5.0 |
| Overall | 5.5 |
Task Achievement / Task Response: Band 5.5
You include the chart’s subject and report all six age-group figures for both sexes, so the response contains relevant detail. However, the overview is not accurate: it says the 15–24 group is highest for both sexes, although women peak at 45–54 (53.3%), and it calls the 65-and-over group lowest for both sexes, although men reach their low at 35–44 (39.5%). The main pattern—that women exceed men in every group except 15–24—is not identified. The figures are mostly reported correctly, but the response relies on a list rather than selecting and explaining the key comparisons. A more precise overview and a few clear comparisons would make the main features easier to understand.
Coherence and Cohesion: Band 5.5
The response has a basic paragraph structure: an introduction, an overview and a body paragraph with the figures. This gives the reader some organisation, and the age groups are presented in chart order. However, progression is limited because the body is one long sentence linked repeatedly with “and,” making the comparisons difficult to follow. The overview also combines several claims without clear relationships, while punctuation such as “highest.,while” interrupts the flow. Grouping the data into two shorter paragraphs—for example, the younger groups and the older groups—and using clear contrast markers such as “whereas” would improve cohesion. The current linking is repetitive and sometimes unclear, so the organisation is only partly effective.
Lexical Resource: Band 5.5
You use some task-relevant vocabulary, including “percentage,” “age,” “physical activity,” “fluctuation,” “increment” and “decrement.” This is enough to communicate the general topic, but the range is limited and several choices are inaccurate or unnatural. “Elucidates information” and “proper illustration” are awkward for describing a chart; “shows” and “compares” would be more natural. Repeated use of “catagories” and “appeared” also reduces precision, and there are spelling errors such as “withe” and “apeared.” The response would be clearer with accurate trend language and varied comparison phrases, rather than repeatedly calling each age band a category.
Grammatical Range and Accuracy: Band 5.0
The response attempts longer sentences and uses some comparative structures, but control is weak, particularly when several figures are joined into one sentence. For example, “during 15 and 24 males percentages are 52.8% and womens percentage are 47.7% is appeared” has problems with sentence structure, agreement and verb form. Similar errors recur in “the man have” and “the women have,” and the final sentence is difficult to parse because clauses are joined without clear punctuation. Capitalisation after full stops is also inconsistent. Use shorter sentences with a clear subject and verb, such as “Among 15–24-year-olds, 52.8% of men were active, compared with 47.7% of women.” This would make the data easier to read and reduce recurring errors.
See this exact question answered at other band scores. The same prompt compared across bands.
Browse more IELTS Writing model answers or get your own writing scored by the same AI examiner.