Band 5.0 IELTS Writing Task 1 Model Answer
Overall Band Score: 5.0 · Cambridge IELTS 12 · 2026-11-13
IELTS Writing Task 1 question
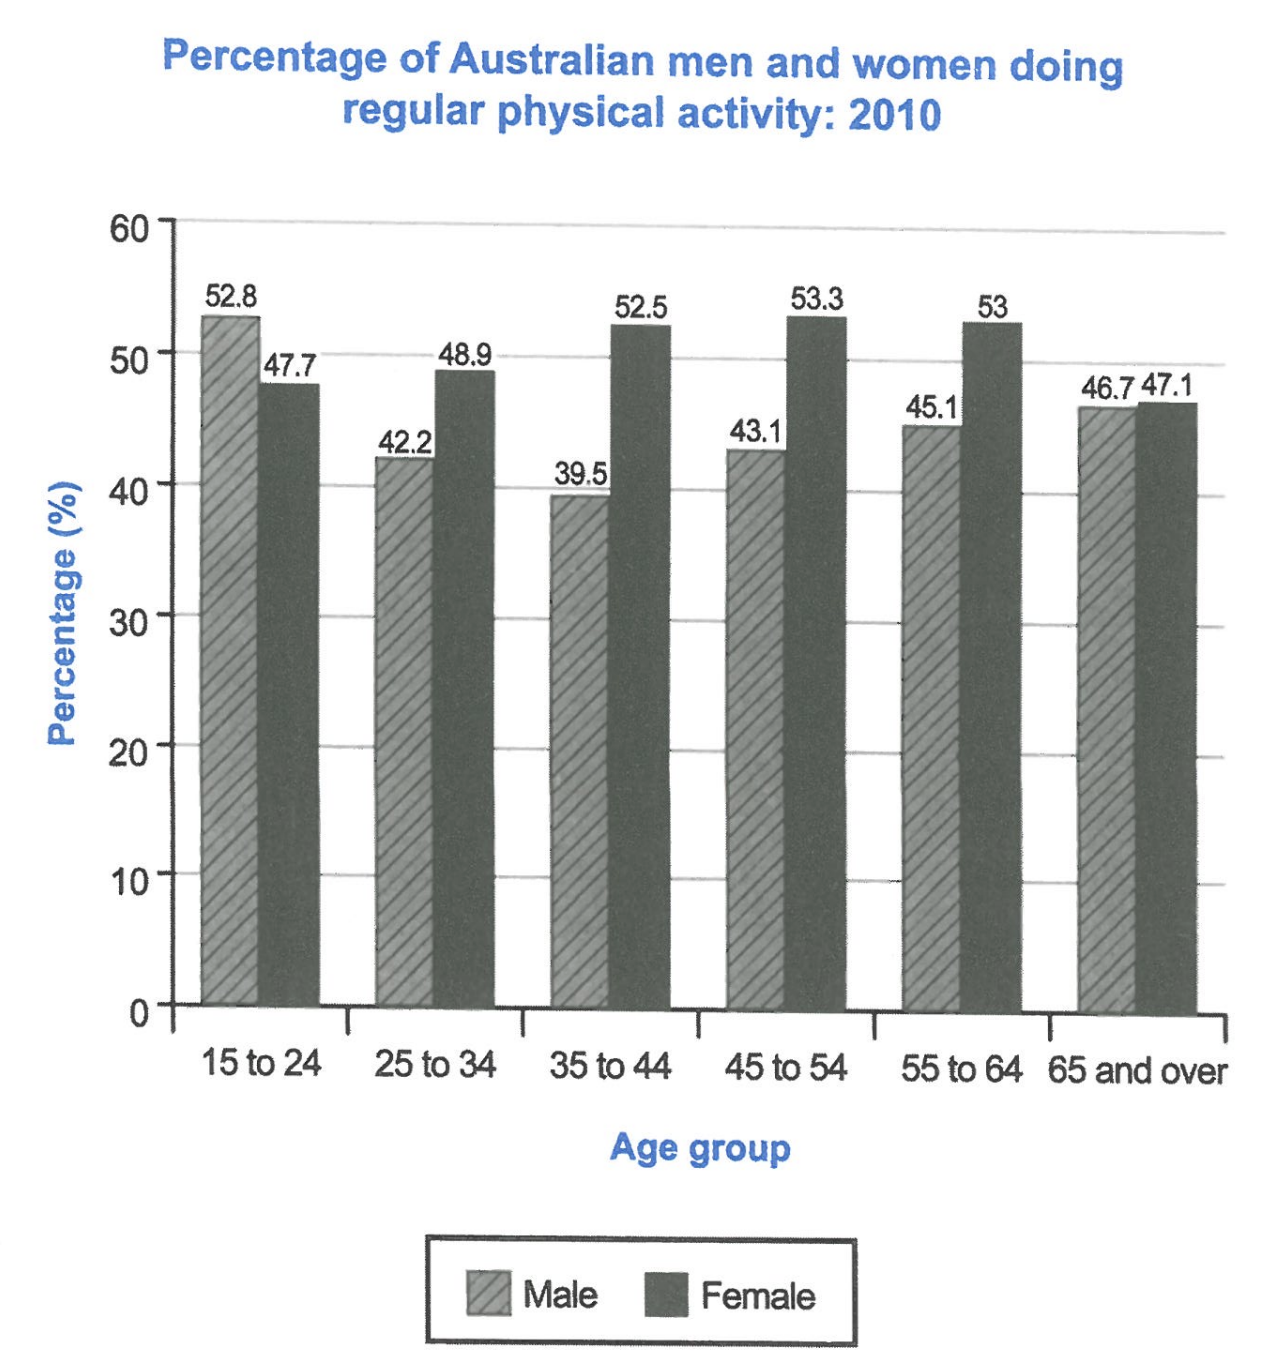
The bar chart below shows the percentage of Australian men and women in different age groups who did regular physical activity in 2010.
Summarise the information by selecting and reporting the main features, and make comparisons where relevant.
Student answer (Band 5.0)
There is a bar chart given in the image which shows the data of Australian people including men and women in different age groups who did regular physical activity in the year of 2010.
The data start with the percentage and the age of people invlolved in physical activities in Australia. 52.8 percent males and 47.7 percent females are invlove in activities with the age of 15 to 24 years old. The last bar is showing the data about 65 years old and over the 65 people including men and women. 52.8 is the largest number of men who did physcial activity in 2010 with minimum age which is 15 to 24. The women highest number is 53.3% with the age of 45 to 54 years old. There has been drop down after 24 years old people until the age of 35. At the age of 65 and over, the percentage is around 47.
According to graph male population is shorter in every age group except 15 to 24 years old. Females population is higher almost 5 to 10 percent in every other age groups which is starting from 25 to 65 and over in 2010.
AI examiner evaluation
| Criterion | Band |
|---|---|
| Task Achievement / Task Response | 5.0 |
| Coherence and Cohesion | 5.0 |
| Lexical Resource | 5.0 |
| Grammatical Range and Accuracy | 5.0 |
| Overall | 5.0 |
Task Achievement / Task Response: Band 5.0
You identify the chart’s subject and report several relevant figures, including the male peak of 52.8% among 15–24-year-olds and the female peak of 53.3% among 45–54-year-olds. You also recognise that women exceed men in most age groups. However, the response only partially summarises the main features: it gives no clear overview of the overall pattern, and the claim that women are “higher almost 5 to 10 percent” is imprecise and overstates some gaps. The male figure falls to 39.5% at ages 35–44 before rising, while female participation peaks around middle age and then declines; these key trends need clearer coverage. The statement about a “drop down after 24” is also incomplete. Organise the most important comparisons and trends rather than describing bars individually.
Coherence and Cohesion: Band 5.0
The response has some organisation: it begins by introducing the chart, then mentions selected age groups and ends with a comparison between men and women. However, there is no clear overall progression from an overview to well-grouped supporting details. Several points are repeated, such as the 15–24 male figure and the general claim that women have higher participation. Linking is limited, and phrases such as “The data start with” and “The last bar” make the account read like a sequence of chart observations rather than a connected summary. Group the figures by trend—for example, male participation falling and then recovering, followed by the female pattern—and use clear transitions to show how the comparisons relate.
Lexical Resource: Band 5.0
You use enough basic vocabulary to identify the chart’s topic and make simple comparisons, including “percentage,” “age group,” “largest number,” and “higher.” However, the range is limited and several word choices or collocations are inaccurate or repetitive. “The data start with the percentage and the age” does not clearly describe what the chart presents, while “male population is shorter” is not an appropriate way to compare activity rates. Spelling errors such as “invloved,” “involve,” and “physcial” are noticeable and reduce clarity. Aim for precise chart language such as “participation rate,” “proportion,” “rose,” “fell,” and “was higher than.” These choices would help you describe trends and comparisons more accurately without relying on repeated references to “data” and “number.”
Grammatical Range and Accuracy: Band 5.0
Your response communicates the general topic, and you attempt some longer sentence forms, such as “According to graph male population is shorter in every age group except 15 to 24 years old.” However, the range is limited, and errors occur frequently in sentence structure, articles, agreement, and verb forms. For example, “52.8 percent males and 47.7 percent females are invlove” lacks the needed preposition and has an incorrect verb form; “The women highest number is 53.3%” also has faulty structure. The sentence about the final age group is difficult to follow because “65 years old and over the 65 people” is not grammatically controlled. Use straightforward, complete sentences with accurate patterns, such as “Among people aged 15–24, 52.8% of men and 47.7% of women exercised regularly.”
See this exact question answered at other band scores. The same prompt compared across bands.
Browse more IELTS Writing model answers or get your own writing scored by the same AI examiner.