Band 5.5 IELTS Writing Task 1 Model Answer
Overall Band Score: 5.5 · Cambridge IELTS 12 · 2026-11-13
IELTS Writing Task 1 question
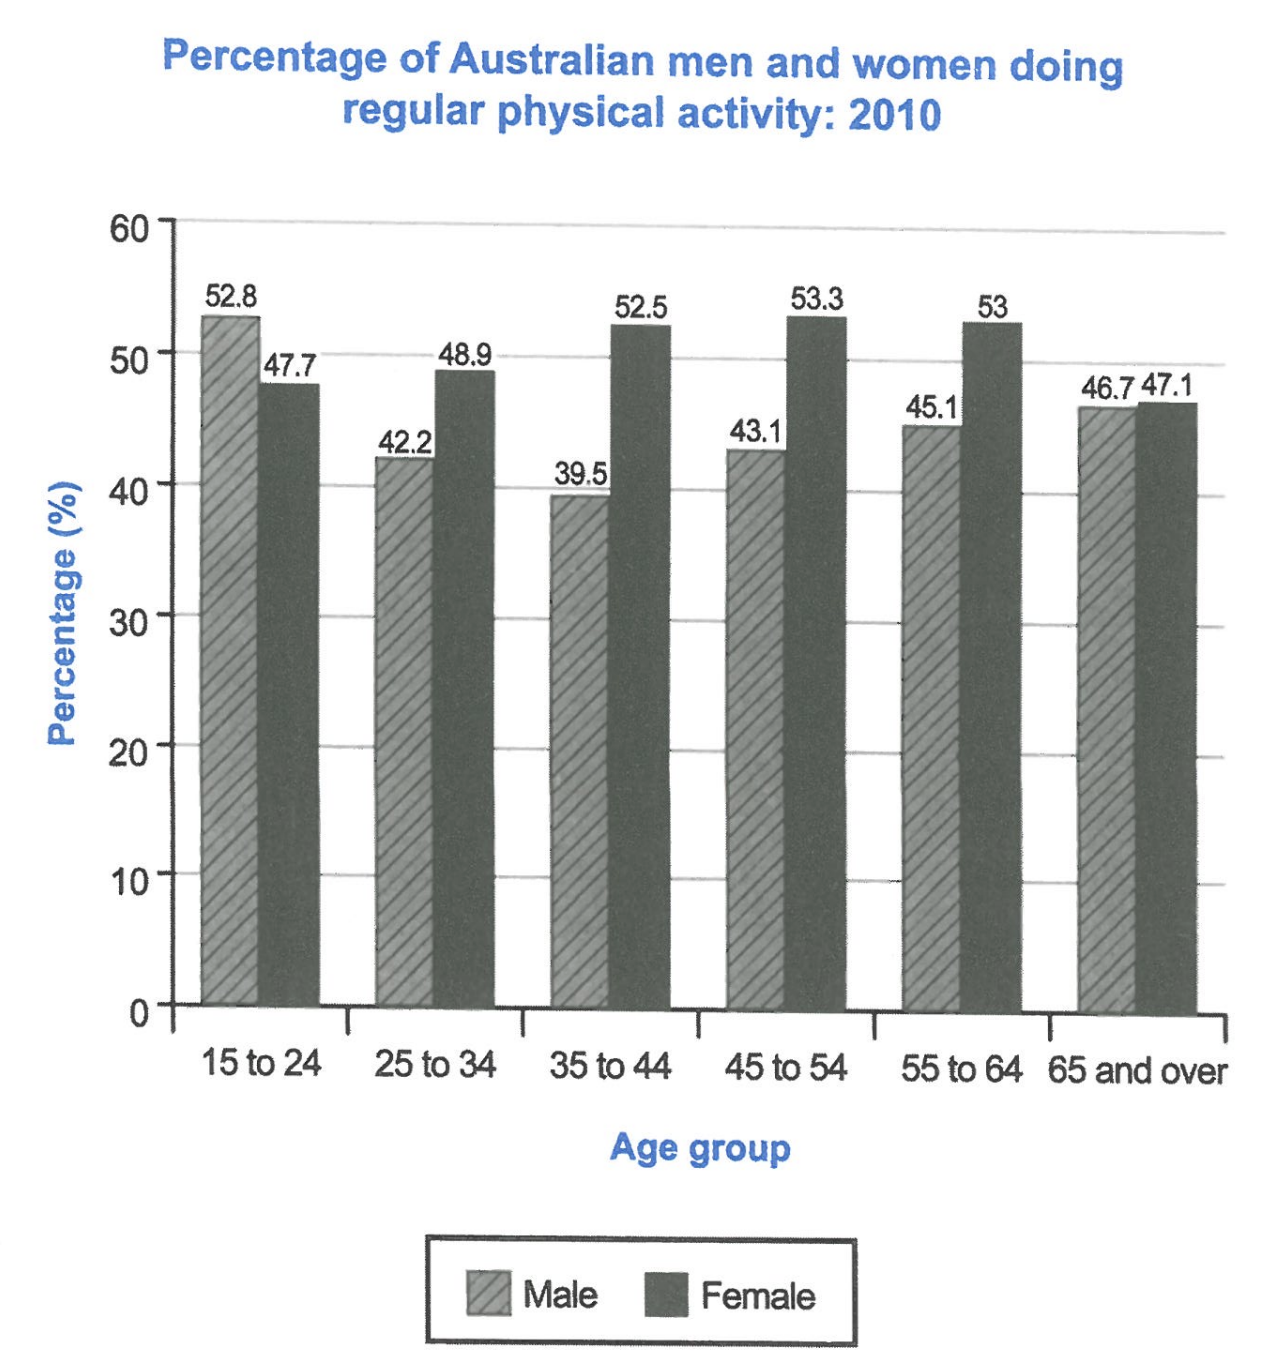
The bar chart below shows the percentage of Australian men and women in different age groups who did regular physical activity in 2010.
Summarise the information by selecting and reporting the main features, and make comparisons where relevant.
Student answer (Band 5.5)
The bar chart illustrates the percentage of Australian people(male and female) of various age groups who participated in physical activities during 2010.
Firsty, the proportion of males aged 15 to 24 age is 52.8%, which marked the highest figure then the figure declined considerably to 42.2% for those aged 25 to 34. After that, it reached its lowest point 39.5% people of 35 to 44 age group and then it started rising gradually 43.1% among 45 to 54 age. And then increased to 45.1% for those aged 55 to 64. Lastly, it reached 46.7% among 65 and over.
On the other hand, the percentage of females aged 45 to 54 is 53.3%, which marked the highest figure in females and then it start decreasing slightly to 53% for those aged 55 to 64, 52.5% for people age group 35 to 44. Whereas, 48.9% people of age group 25 to 34 then it decreased to 47.7% among 15 to 24. The percentage of both( male and female) of 65 and over were almost same about 46.7% and 47.15 respectively.
AI examiner evaluation
| Criterion | Band |
|---|---|
| Task Achievement / Task Response | 5.0 |
| Coherence and Cohesion | 6.0 |
| Lexical Resource | 6.0 |
| Grammatical Range and Accuracy | 5.5 |
| Overall | 5.5 |
Task Achievement / Task Response: Band 5.0
You report several accurate figures and identify important patterns, including the male decline to 39.5% among 35–44-year-olds followed by a rise, and the female peak of 53.3% among 45–54-year-olds. However, the response mainly lists changes within each sex rather than giving a clear overall summary of the chart. A key comparison is that women had higher participation than men in every age group except 15–24, but this is not stated; the opening also lacks a distinct overview. The female figures are presented in a confusing order, and the final comparison gives 47.15 rather than the chart’s 47.1%. To strengthen the report, add a concise overview of the main gender contrast and broad trends, then select and compare the most significant figures accurately.
Coherence and Cohesion: Band 6.0
The response has a coherent basic arrangement: an introduction is followed by a paragraph on men and one on women. Sequencing expressions such as “After that,” “On the other hand,” and “Lastly” help readers follow the figures. However, the progression is sometimes mechanical, and the female paragraph moves backwards through age groups after describing the peak, making the sequence harder to track. “Whereas” introduces a fragment rather than a complete contrast, and “both” in the final sentence does not clearly refer to the two groups. Organise the data consistently from youngest to oldest, and use linking phrases to show meaningful comparisons between men and women, not only to mark the next figure.
Lexical Resource: Band 6.0
You use an adequate range of chart-reporting vocabulary, including “proportion,” “declined,” “lowest point,” “rising gradually,” and “percentage.” These choices generally communicate the trends, and the repeated use of percentages keeps the subject clear. Some expressions are inaccurate or awkward for formal data description, however: “participated in physical activities” is less precise than the task’s regular-activity measure, while “marked the highest figure” and “people of age group” are unnatural collocations. “Firsty” is also misspelled, and “47.15” is an imprecise way to report the value. Aim for concise, conventional phrasing such as “the participation rate peaked at” and “women aged 35–44,” and check spelling and numerical notation.
Grammatical Range and Accuracy: Band 5.5
You attempt both simple statements and longer sentences with relative clauses, for example, “which marked the highest figure,” and the main trends are usually understandable. Some grammatical errors remain, particularly in sentence construction and verb forms. “The proportion of males aged 15 to 24 age is” has an unnecessary second “age,” while “then it start decreasing” needs a past-tense verb to match the 2010 data. The sequence “Whereas, 48.9% people…” is not a complete sentence, and “the percentage of both … were” has a subject–verb agreement problem. There are also punctuation and spacing issues around parentheses. Use complete sentences, maintain past tense consistently, and check agreement and article use when describing percentages.
See this exact question answered at other band scores. The same prompt compared across bands.
Browse more IELTS Writing model answers or get your own writing scored by the same AI examiner.