Band 4.5 IELTS Writing Task 1 Model Answer
Overall Band Score: 4.5 · Cambridge IELTS 12 · 2026-11-13
IELTS Writing Task 1 question
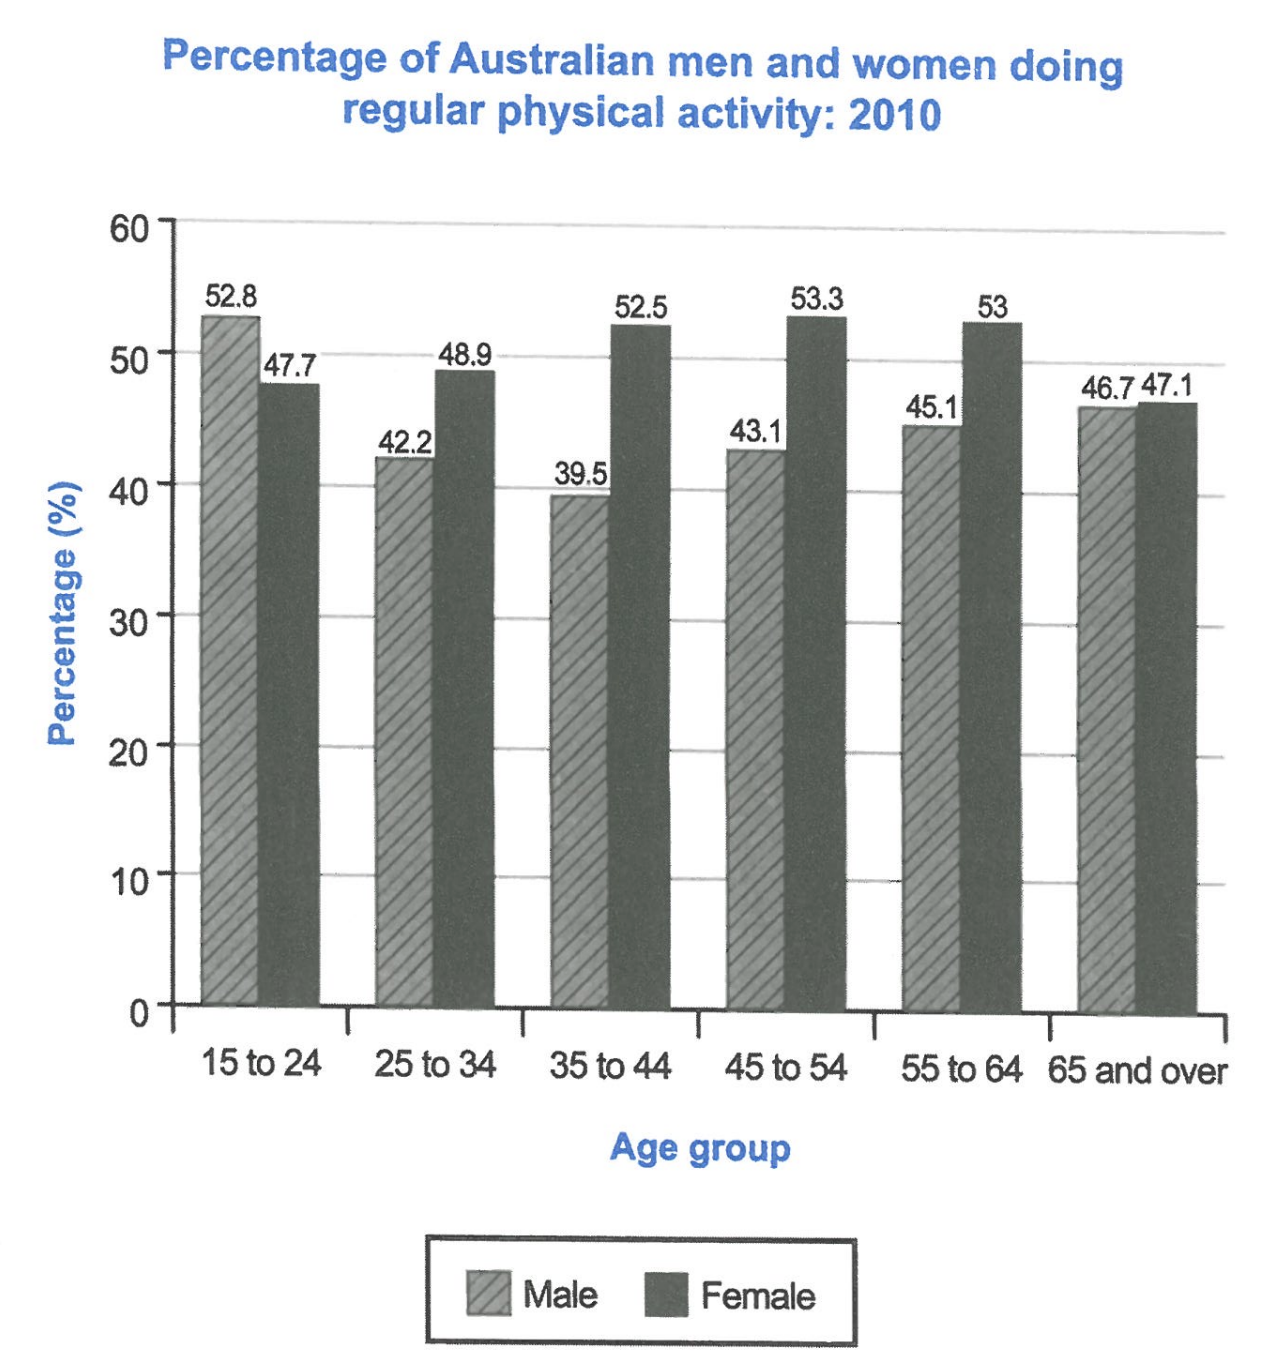
The bar chart below shows the percentage of Australian men and women in different age groups who did regular physical activity in 2010.
Summarise the information by selecting and reporting the main features, and make comparisons where relevant.
Student answer (Band 4.5)
The chart illustrates the average of men and women in Australia who are involve in physical activity. This graph shows the changes in the percentage of people over the time it increase and decrease gradually. These six percentages shows different numbers three show increase in graph and other three show the decreae in the graph.
First, graph demonstrate the increase in number about 52.8 then less to 47.7 in the same time frame. Similarly, the other graph is 42.2 and then it increase to 48.9 which is increase bit regarding the previous one. The third graph shows a massive increase from 39.5 to 52.5 which is very good to see people involve in physical activity.
On the other hand two graphs show same growth with the difference of.5 and the last one is almost same in numbers 46.7 to 47.1.
All these graphs shows the people intrest in physical activity in Austraila which increase and decrease with the passage of time.
AI examiner evaluation
| Criterion | Band |
|---|---|
| Task Achievement / Task Response | 4.5 |
| Coherence and Cohesion | 4.5 |
| Lexical Resource | 5.0 |
| Grammatical Range and Accuracy | 4.5 |
| Overall | 4.5 |
Task Achievement / Task Response: Band 4.5
You identify the chart’s general subject and include several figures, such as 52.8 and 47.7 for the youngest group and 39.5 and 52.5 for ages 35–44. However, the response only minimally summarises the data: it does not clearly identify which figures belong to men or women, and the overview that “three show increase” and “other three” decrease is unclear and does not accurately describe the overall pattern. The chart’s key feature is that men start higher in the youngest group, while women have higher activity rates in every other age group; women peak around middle age, whereas men reach their low point at 35–44 before rising. Select and compare these main trends explicitly, rather than describing the bars as separate “graphs.”
Coherence and Cohesion: Band 4.5
There is some basic organisation: an opening statement is followed by a paragraph of comparisons and a concluding sentence, and “First” and “On the other hand” signal transitions. However, the progression is difficult to follow because the comparisons are not consistently tied to age groups or to men and women. For example, “the other graph is 42.2 and then it increase to 48.9” leaves the reader to infer which age groups and sexes are being compared. The final paragraph repeats the general idea of increases and decreases rather than drawing the main comparisons together. Organise the body by age groups or by sex, use clear references such as “men” and “women,” and make each paragraph develop one identifiable comparison.
Lexical Resource: Band 5.0
Your vocabulary is sufficient to communicate the broad topic, with relevant terms such as “percentage,” “physical activity,” “increase,” and “decrease.” However, the range is limited and several choices are imprecise or repetitive. Calling the data “graphs” is inaccurate for individual bars, while “the average of men and women” does not express what the chart measures. Phrases such as “very good to see” introduce an informal personal reaction rather than neutral report language, and “people intrest” is both misspelled and awkwardly phrased. Use precise chart vocabulary and neutral expressions—for example, “proportion,” “rate,” “bar,” “rose,” and “fell”—and check spelling and collocations to make comparisons clearer.
Grammatical Range and Accuracy: Band 4.5
You attempt both simple and linked sentences, but control is inconsistent, and errors sometimes make relationships between figures unclear. Examples include “who are involve,” “These six percentages shows,” and “the other graph is 42.2 and then it increase,” which show problems with verb forms and subject–verb agreement. The sentence “On the other hand two graphs show same growth with the difference of.5” is also incomplete or unclear in its construction and punctuation. Most sentences follow a basic pattern, with little accurate variety in complex structures. Practise forming comparisons with a clear subject and verb, such as “The male rate fell from 52.8% to 42.2%,” and check agreement, articles, and punctuation before finishing.
See this exact question answered at other band scores. The same prompt compared across bands.
Browse more IELTS Writing model answers or get your own writing scored by the same AI examiner.