Band 6.0 IELTS Writing Task 1 Model Answer
Overall Band Score: 6.0 · Cambridge IELTS 12 · 2026-11-14
IELTS Writing Task 1 question
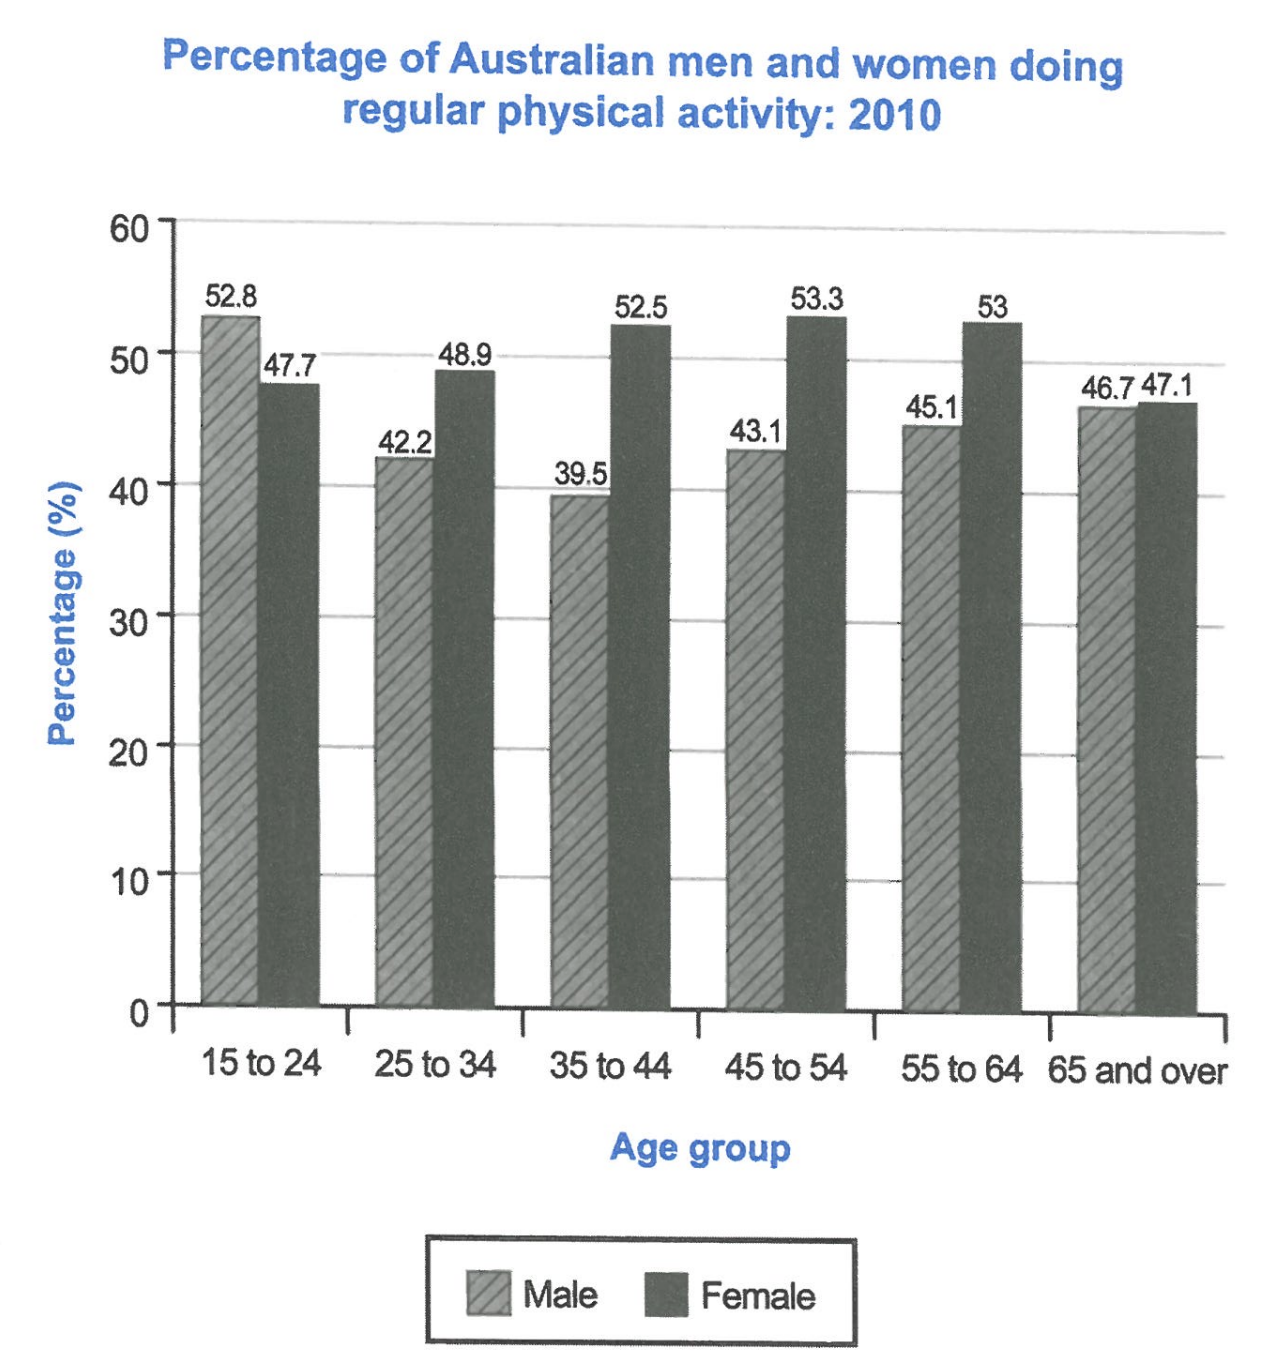
The bar chart below shows the percentage of Australian men and women in different age groups who did regular physical activity in 2010.
Summarise the information by selecting and reporting the main features, and make comparisons where relevant.
Student answer (Band 6.0)
The bar chart below gives a percentile comparison between Australian males and females with alternate demographics who exercised regularly in year 2010.
Overall, males between the age 15 to 24 had the higher percentage than their female counterpart. in all other age demographics women had the higher percentage of regular physical activity than men.
Coincidentally, males between ages 15 to 24 also had the highest percentage recorded among all groups of males. The female age group with the highest percentage is from the age 45 to 54.
The regular exercise among the males group started at the highest point with 52.8% among the age 15 to 24. Then the percentage went down almost 10% (for ages 25 to 34). The lowest percentage among males is between age 35 to 44 with only 39.5% doing activities regularly. Then the bar increases slightly and goes to 43% for ages 45 to 54. The bar continues to increase for older males and shows a consistent increase jumping to 45% for males between 55 to 64. Males with age 65 and above shows a real close match with females with 46.
AI examiner evaluation
| Criterion | Band |
|---|---|
| Task Achievement / Task Response | 6.5 |
| Coherence and Cohesion | 6.5 |
| Lexical Resource | 6.0 |
| Grammatical Range and Accuracy | 5.5 |
| Overall | 6.0 |
Task Achievement / Task Response: Band 6.5
You identify the main gender pattern accurately: men lead only in the 15–24 group, while women have higher activity rates in the other age groups. You also correctly note that young men record the male peak and identify 45–54 as the female peak. The male figures are reported with reasonable accuracy, although some are rounded. However, the response gives almost no figures or trend description for women, despite their rates being central to the comparison, and the final comparison for people aged 65 and over is incomplete: the values are 46.7% for men and 47.1% for women, not simply a “close match with females with 46.” Covering the female pattern more fully would make the summary more balanced and complete.
Coherence and Cohesion: Band 6.5
The response has a clear overall shape: an introduction, a brief overview, and a paragraph describing the male figures in age order. This makes the main direction of the male trend easy to follow, and linking words such as “Then” and “The bar continues to increase” help show sequence. The overview also gives the reader a useful framework for the comparisons. However, the body focuses almost entirely on men, so the organisation does not fully develop the comparison promised in the overview. The final sentence feels unfinished and does not clearly connect the two figures. A separate paragraph tracing the female pattern, with direct comparisons at key ages, would create more balanced progression and clearer cohesion.
Lexical Resource: Band 6.0
You use a sufficient range of vocabulary to describe the chart, including “percentage,” “highest point,” “lowest percentage,” and “consistent increase.” These choices generally communicate the trends, and the meaning remains clear. Some expressions are imprecise or unnatural for this task, however. “Percentile comparison” is not the right term for percentages, while “alternate demographics” and “real close match” are awkward. “The bar increases” also describes the visual rather than the data; it is more natural to say that the rate rises. Repeated use of “percentage” and “age” limits flexibility. Choose precise chart language and vary terms such as “proportion,” “rate,” and “figure,” while checking collocations.
Grammatical Range and Accuracy: Band 5.5
You attempt both simple and more extended sentence forms, and most of the information can be understood. For example, “Then the percentage went down almost 10%” and “The bar continues to increase for older males” show an effort to describe change across age groups. Some grammatical errors remain, including the missing capital in “in all other age demographics,” the awkward construction “between the age 15 to 24,” and agreement in “Males with age 65 and above shows.” The final sentence also lacks a clear, complete comparison structure. Use “men aged 15 to 24” or “between the ages of 15 and 24,” maintain subject–verb agreement, and punctuate sentence openings consistently. These corrections would improve accuracy while preserving your range.
See this exact question answered at other band scores. The same prompt compared across bands.
Browse more IELTS Writing model answers or get your own writing scored by the same AI examiner.