Band 6.5 IELTS Writing Task 1 Model Answer
Overall Band Score: 6.5 · Cambridge IELTS 12 · 2026-11-15
IELTS Writing Task 1 question
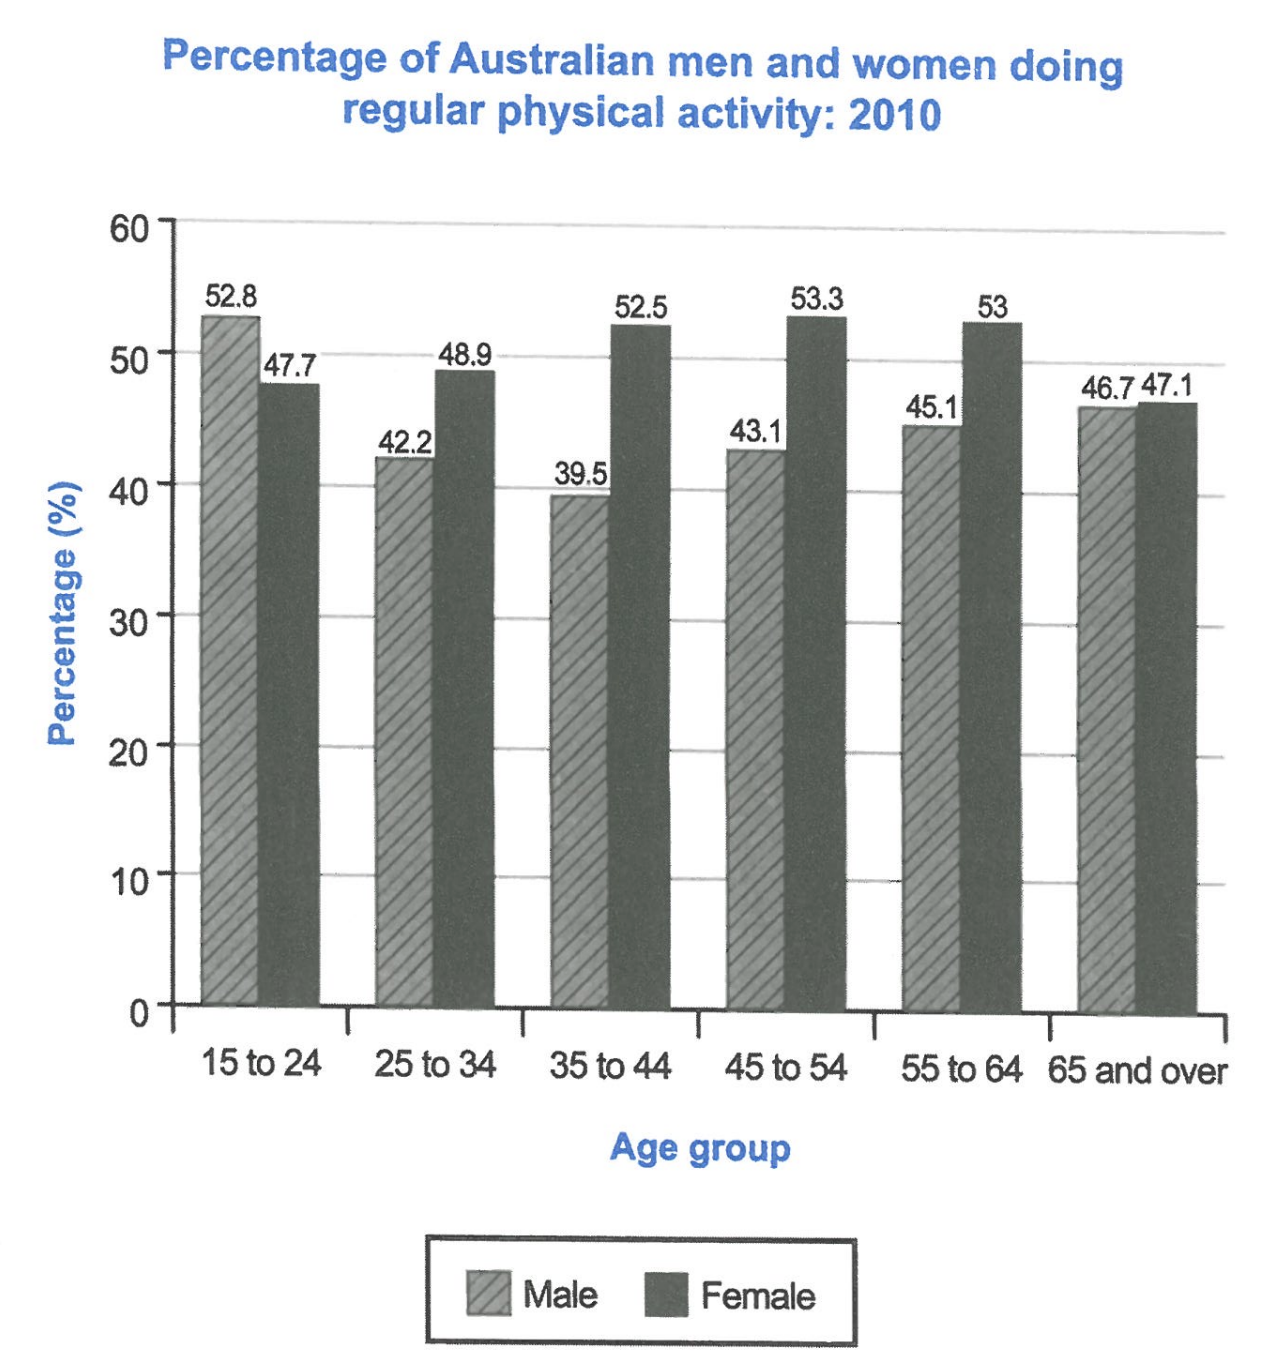
The bar chart below shows the percentage of Australian men and women in different age groups who did regular physical activity in 2010.
Summarise the information by selecting and reporting the main features, and make comparisons where relevant.
Student answer (Band 6.5)
The bar chart compares the percentage of Australian males and females in different age groups who did regular exercise in 2010.
Overall, except the 15 to 24 age group, in other age groups the percentage of males was less than the percentage of females. The percentages of females in the 45 to 54 age group was the highest among all the percentages.
The percentage of males in the 15 to 24 age group was the highest among all the male age groups, and the third highest among all the males and females age groups, which was 52.8%. Additionally, for the same age group the percentage of females was 47.7%, which was lower than the percentage of males. The percentages of males and females in the 65 and over age group were nearly close, which were respectively 46.7% and 47.1%. However, the percentage of females in the 65 and over age group was the lowest among all the percentages of females.
The percentage of females in the 45 to 54 was the highest among all the age groups, which was 53.3%. In contrast, the percentage of males in the same age group was at 43.1%. The percentages of females in the 55 to 64 age group is the second highest, which was 53%, whereas the percentage of males for the same age group was at 45.1%. The percentage of males in the 35 to 44 was the lowest among all the percentages, which was 39.5%.
AI examiner evaluation
| Criterion | Band |
|---|---|
| Task Achievement / Task Response | 7.0 |
| Coherence and Cohesion | 6.5 |
| Lexical Resource | 6.5 |
| Grammatical Range and Accuracy | 6.5 |
| Overall | 6.5 |
Task Achievement / Task Response: Band 7.0
You identify the chart’s main pattern accurately: men lead only in the youngest group, while women have higher figures in every other age group. The overview also highlights the female peak at 45–54, and the body supports this with relevant figures, including 52.8% for young men, 53.3% for women aged 45–54, and the close results among those aged 65 and over. You also identify the male low of 39.5% at ages 35–44. This gives the response clear coverage and relevant support. To make the account more fully developed, compare the middle-age figures more directly—for example, women’s rates rise to a peak while men’s fall and then recover—and avoid the slightly unclear claim that 52.8% is “the third highest among all the males and females age groups.”
Coherence and Cohesion: Band 6.5
The response has a clear overall structure: an introduction, an overview, and two paragraphs reporting details. The information generally progresses from the broad gender pattern to selected age-group comparisons, and linking expressions such as “Overall,” “Additionally,” and “In contrast” help guide the reader. This is a coherent arrangement, but cohesion is not always smooth or economical. Several sentences repeat the same “percentage of males/females in the … age group” pattern, and “However” introduces the female low at 65 and over without a strong contrast to the preceding point. Some references, such as “which was lower,” are also less direct than naming the figure or group. Grouping the age bands into clearer trends and varying sentence openings would make progression more flexible.
Lexical Resource: Band 6.5
You use an adequate range of task-relevant vocabulary, including “percentage,” “age group,” “highest,” “lowest,” and “in contrast,” so the chart’s information remains clear. There is some variation between “males” and “men” and between “females” and “women,” although the repeated phrase “the percentage of … in the … age group” makes the description sound formulaic. A few collocations are inaccurate or unnatural: “nearly close” is redundant, and “all the males and females age groups” is not a natural way to describe a combined ranking. More precise trend language, such as “peaked,” “declined,” or “recovered,” would help you compare the series rather than mainly list values. Aim for natural combinations and concise phrasing while retaining the accurate chart vocabulary.
Grammatical Range and Accuracy: Band 6.5
You use a mix of simple statements and more complex forms, including the opening comparison “except the 15 to 24 age group” and clauses introduced by “which” and “whereas.” Meaning is generally clear, and several sentences are grammatically controlled. Some errors remain in agreement and sentence construction: “The percentages of females … was the highest” should use “were,” while “The percentages … is the second highest” also has a subject–verb mismatch. In “The percentage of females in the 45 to 54 was the highest,” the age-group noun is omitted, and “which were respectively” creates an awkward reference to a singular percentage for each group. Check singular/plural agreement and make the noun each reference points to explicit; this will improve accuracy without sacrificing your attempts at complex sentences.
See this exact question answered at other band scores. The same prompt compared across bands.
Browse more IELTS Writing model answers or get your own writing scored by the same AI examiner.