Band 6.0 IELTS Writing Task 1 Model Answer
Overall Band Score: 6.0 · Cambridge IELTS 12 · 2026-11-15
IELTS Writing Task 1 question
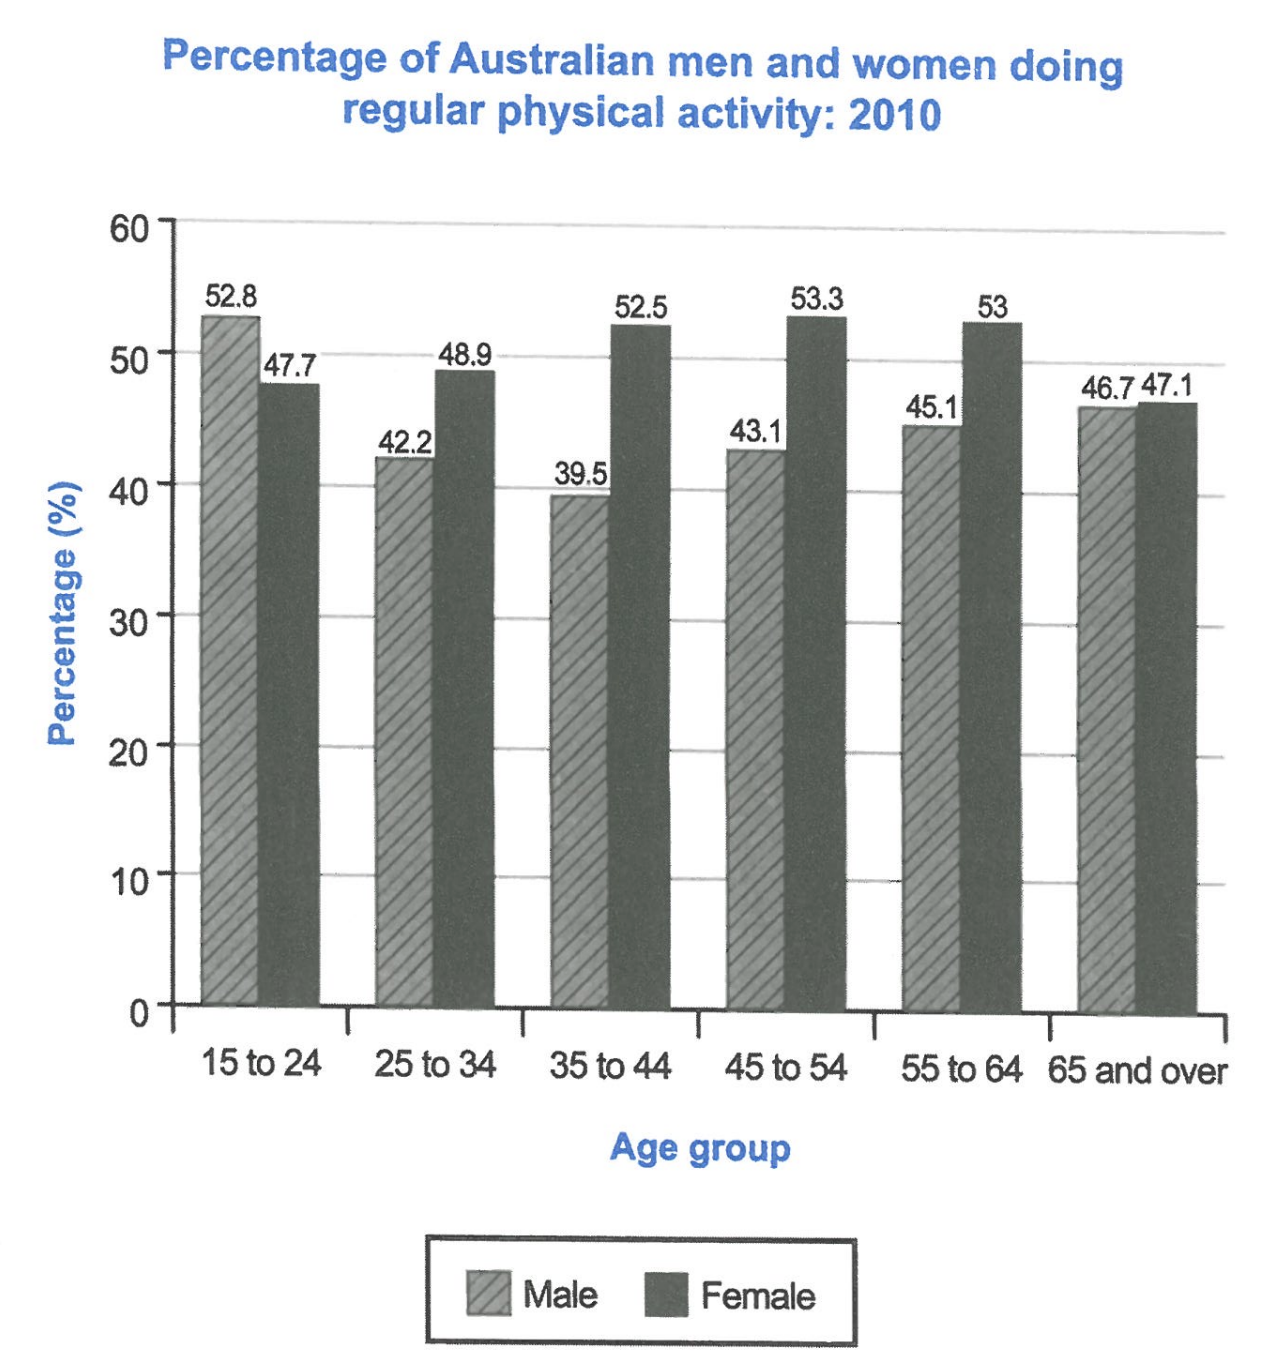
The bar chart below shows the percentage of Australian men and women in different age groups who did regular physical activity in 2010.
Summarise the information by selecting and reporting the main features, and make comparisons where relevant.
Student answer (Band 6.0)
The bar chart illustrates the proportion of Australian men and women in various age groups who participated in regular physical activity in 2010.
Overall, women had the lead in physical activity in almost all age range compared to men. The highest difference in men and women can be seen in age 35 to 44. However, men and women in 65 and above had similar ratio.
Men ony had lead in one age range which was from 15 to 24. Men had the ration of 52.8% while women had 47.7%. Except this, women had more proportion than men in all age groupes. The highest gap was in age group of 35 to 44. Men and women both had a ratio of 39.5% and 52.5% respectively. Approximately 13% of difference was seen.
Both men and women who were aged 65 and above had similar proportion in physical activity. Women had 47.1% and men had 46.7% of toal proportion. A noticeable data was that women aged between 35 to 64 had percentages above 50% whereas men barely reached 45%.
AI examiner evaluation
| Criterion | Band |
|---|---|
| Task Achievement / Task Response | 7.0 |
| Coherence and Cohesion | 6.0 |
| Lexical Resource | 5.5 |
| Grammatical Range and Accuracy | 5.5 |
| Overall | 6.0 |
Task Achievement / Task Response: Band 7.0
You identify the main pattern accurately: men lead only among 15–24-year-olds, women lead in the other groups, and the figures for those aged 65 and over are close. The overview also highlights the largest gender gap, and the supporting figures for ages 15–24 and 35–44 are correct. The observation that women’s rates were above 50% from 35 to 64, while men’s were below 45% in those groups, adds a useful comparison. To make the report more fully developed, describe the overall movement across age groups: men’s rate falls to a low at 35–44 before rising, while women’s rate rises to a peak at 45–54 and then declines. This would give a clearer account of the chart’s trends, not just its gender differences.
Coherence and Cohesion: Band 6.0
The response has a clear overall arrangement: an introduction, an overview, and paragraphs giving comparisons and figures. The progression from the general gender pattern to specific age groups is easy to follow, and linking expressions such as “Overall,” “Except this,” and “However” help signal relationships. However, some connections are mechanical or unclear. “The highest difference in men and women” is followed by a repeated explanation of the same gap, and “A noticeable data was that” does not smoothly introduce the final comparison. The paragraphing also separates the 65-and-over comparison from the other detailed figures without a strong reason. Grouping the age trends more deliberately and using clearer references would make cohesion more natural.
Lexical Resource: Band 5.5
You use relevant task vocabulary, including “proportion,” “regular physical activity,” “age group,” and “percentage,” and the meaning is generally clear. There is some repetition of “ratio,” “proportion,” and “had,” while several expressions are inaccurate or unnatural for describing chart data: “women had the lead,” “highest difference in men and women,” and “a noticeable data.” Spelling slips such as “ony,” “groupes,” and “toal” also reduce accuracy. Aim for precise collocations such as “the rate was higher,” “the widest gender gap,” and “a notable feature.” Varying the language for comparisons and trends, while checking spelling and word forms, would make the report more fluent and precise.
Grammatical Range and Accuracy: Band 5.5
You use a mixture of simple statements and some more developed structures, including “whereas” and “who were aged 65 and above,” and most comparisons remain understandable. However, some grammatical patterns are not controlled consistently. For example, “women had the lead in almost all age range” has a number-agreement problem, and “Men and women both had a ratio of 39.5% and 52.5% respectively” does not form a clear comparison structure. The sentence beginning “A noticeable data was that” also has an awkward construction. Work on plural forms, articles, and parallel structures when reporting paired figures. More consistently accurate complex sentences would strengthen the range already attempted.
See this exact question answered at other band scores. The same prompt compared across bands.
Browse more IELTS Writing model answers or get your own writing scored by the same AI examiner.