Band 5.0 IELTS Writing Task 1 Model Answer
Overall Band Score: 5.0 · Cambridge IELTS 12 · 2026-11-15
IELTS Writing Task 1 question
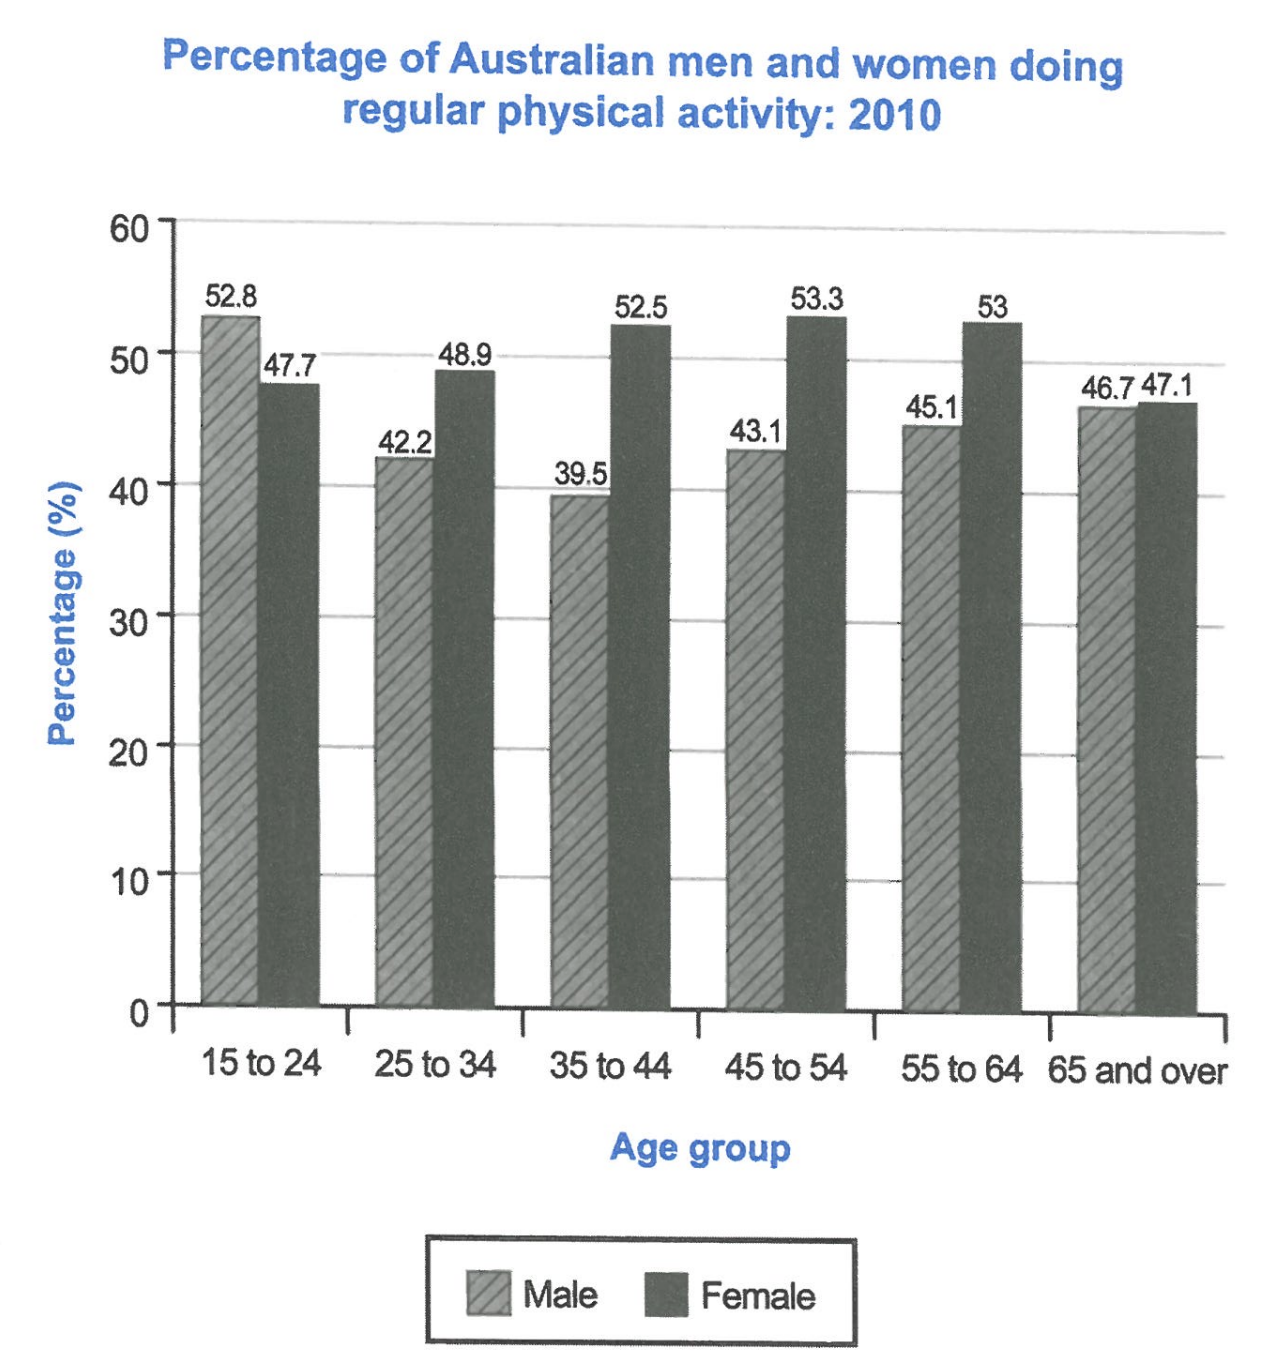
The bar chart below shows the percentage of Australian men and women in different age groups who did regular physical activity in 2010.
Summarise the information by selecting and reporting the main features, and make comparisons where relevant.
Student answer (Band 5.0)
The given bar chart illustrates the percentage of a Australian men and women in diffrent age groups who did regular physical activity in 2010. On the left side of the graph , There is percentage . Moreover, on the x axis there is age group. the following will be discussed in the paragarph.
First, the age group of 15 to 24 demonstrates there is surge in mens physical activity compare to womens . The mens are accounted for 52.8% and women are 47.7 %.Furthermore, This is also recorded as the highest in all the groups. moreover, there is a drop viwed in the age 25 to 34 which is accounted for 42 % in mens and womens Pecentage got spike by 48.9% . whereas , This was same in 35 to 44 age groups also. the mens precentage got sored . In addition, The womens percenatge surged .Age group of 45 to 54 and 55 to 64 were constent . Last but not the least . The age group of 65 and above was lowest recored in graph.
Overall , After viewing all the perspective . The highest Acitivity percentage recorded was in the age group of 15 to 24 . Furthermore , the least was recorded in age 65 and above
AI examiner evaluation
| Criterion | Band |
|---|---|
| Task Achievement / Task Response | 5.0 |
| Coherence and Cohesion | 5.0 |
| Lexical Resource | 5.0 |
| Grammatical Range and Accuracy | 4.5 |
| Overall | 5.0 |
Task Achievement / Task Response: Band 5.0
You identify the chart’s subject and include several relevant figures, such as 52.8% for men and 47.7% for women aged 15–24, and 48.9% for women aged 25–34. However, the main features are only partly and sometimes inaccurately reported. The claim that 15–24 is the highest age group overall overlooks women’s higher figures in several middle age groups, while 65 and over is not the lowest for both sexes: men’s lowest rate is 39.5% at ages 35–44. The description of the 35–44 group is also unclear and reverses the actual trends: men fall to 39.5%, while women rise to 52.5%. Give a clear overview of the contrasting trends and support it with accurate comparisons.
Coherence and Cohesion: Band 5.0
The response has an introduction, a body paragraph and a concluding overview, so there is some basic organisation. However, progression within the body is difficult to follow: the discussion moves between age groups and sexes without consistently comparing the two series, and statements such as “whereas, This was same in 35 to 44 age groups also” do not make the relationship clear. Linking expressions—including “Moreover,” “Furthermore,” and “Last but not the least”—are repetitive or do not accurately signal the connection between ideas. The overview repeats the claim about the highest and lowest groups rather than synthesising the overall pattern. Organise the body by age-group comparisons and use fewer, more precise transitions to make the sequence easier to follow.
Lexical Resource: Band 5.0
You attempt vocabulary relevant to describing data, including “percentage,” “surge,” “drop,” and “recorded.” However, the range is limited, and several word choices or collocations make the meaning unclear, as in “the mens physical activity compare to womens” and “the mens precentage got sored.” Spelling errors such as “diffrent,” “paragarph,” “Pecentage,” and “constent” are noticeable and reduce clarity. Some expressions, including “After viewing all the perspective,” are not natural in this context. Build a more accurate set of chart-description phrases, such as “the proportion of men,” “fell to,” “rose to,” and “remained relatively stable,” and check spelling and word forms carefully.
Grammatical Range and Accuracy: Band 4.5
The response uses mostly simple sentence patterns, with attempts to connect clauses using words such as “whereas” and “Moreover.” However, these attempts are often faulty, and frequent errors in articles, agreement, sentence boundaries and punctuation can make the meaning difficult to follow. For example, “a Australian men and women” has an incorrect article and number pattern, while “the age group of 15 to 24 demonstrates there is surge” has an awkward clause structure and missing article. Capitalisation after commas is inconsistent, and several fragments, including “Last but not the least,” interrupt the flow. Practise accurate simple comparisons first, then combine them into controlled complex sentences, checking articles, verb forms and punctuation.
See this exact question answered at other band scores. The same prompt compared across bands.
Browse more IELTS Writing model answers or get your own writing scored by the same AI examiner.