Band 4.0 IELTS Writing Task 1 Model Answer
Overall Band Score: 4.0 · Cambridge IELTS 12 · 2026-11-15
IELTS Writing Task 1 question
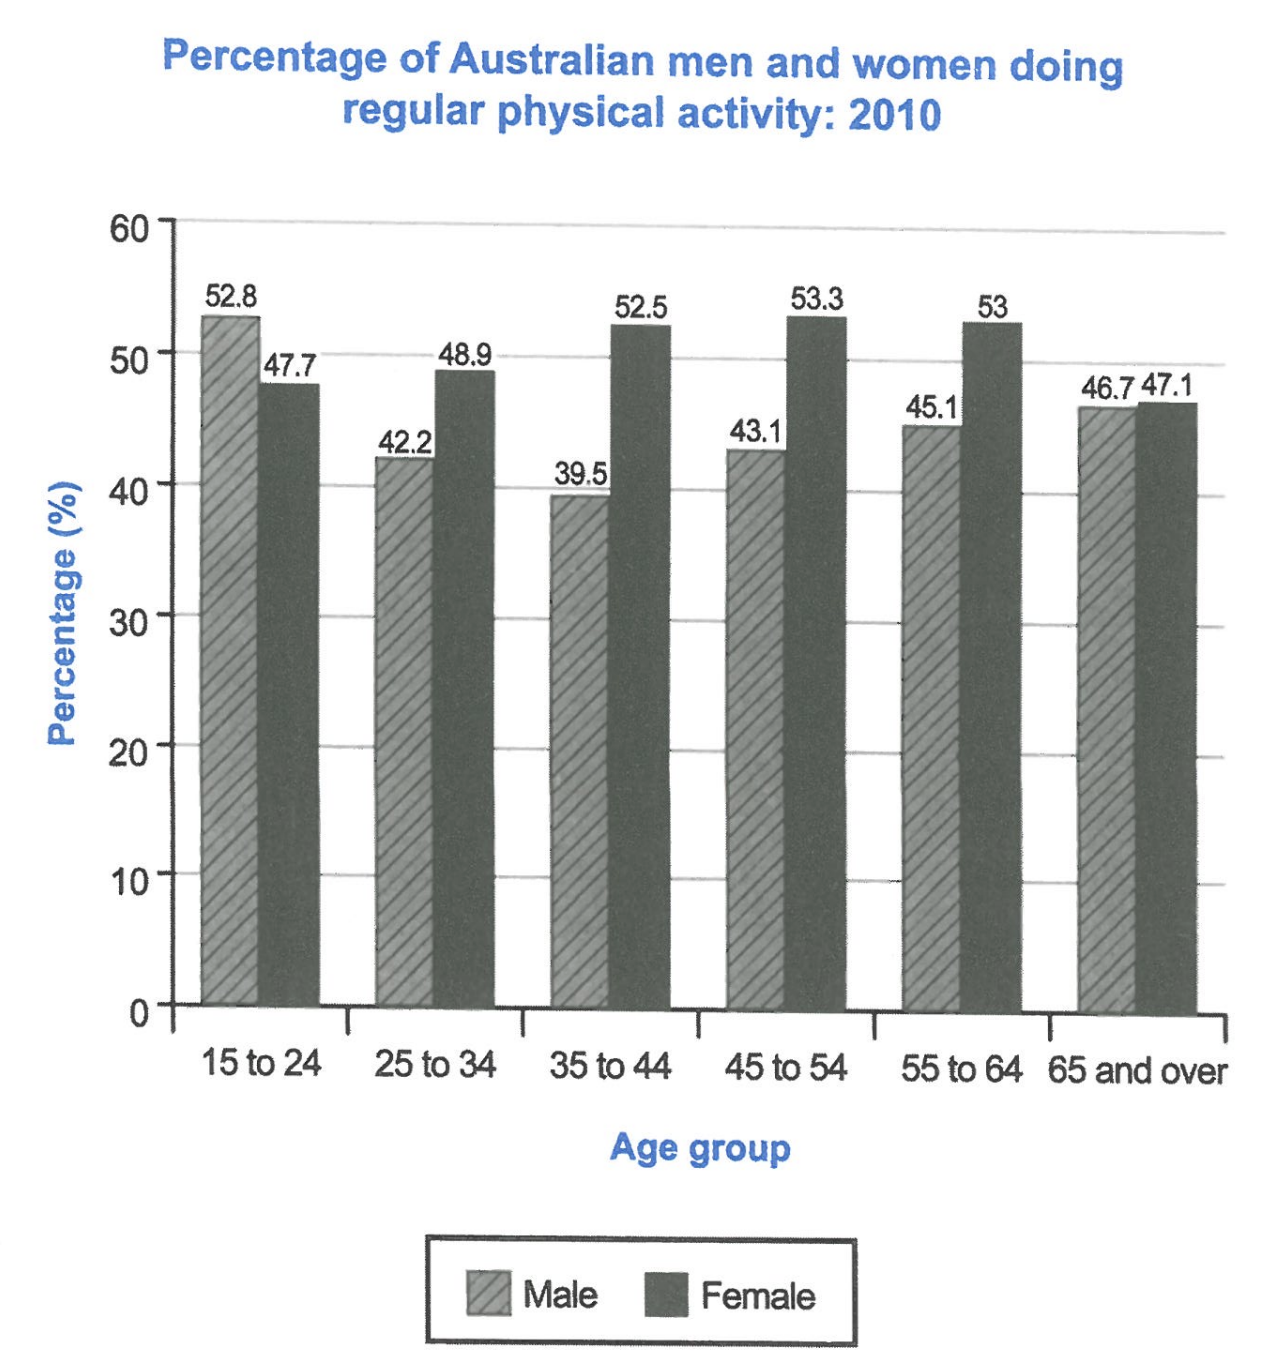
The bar chart below shows the percentage of Australian men and women in different age groups who did regular physical activity in 2010.
Summarise the information by selecting and reporting the main features, and make comparisons where relevant.
Student answer (Band 4.0)
The chart illustrate the ratio of australian men and women in Several generations who did regular physical activity between 2010.
Overall, it was noticed that the percentage of female is in 45 to 54 showed the higest trend in 2010, While male recorded the maximum in the age of 15 to 24. In contrast,
AI examiner evaluation
| Criterion | Band |
|---|---|
| Task Achievement / Task Response | 3.0 |
| Coherence and Cohesion | 3.5 |
| Lexical Resource | 4.5 |
| Grammatical Range and Accuracy | 4.5 |
| Overall | 4.0 |
Task Achievement / Task Response: Band 3.0
The response identifies two relevant extremes: women aged 45–54 had the highest female figure, and men aged 15–24 had the highest male figure. However, it gives no percentages and does not describe the main pattern across the age groups, such as women being more active than men in every group except 15–24. The overview is also left unfinished: “In contrast,” introduces a comparison that never follows. Most importantly, the response is far below the required 150 words, so it cannot provide the summary and comparisons the task requires. To improve, complete the overview and add accurate comparisons supported by selected figures from the chart.
Coherence and Cohesion: Band 3.5
There is a basic attempt to organise the response into an introductory sentence and an overview paragraph, and “Overall” signals a shift to the main features. However, the progression stops abruptly after “In contrast,” leaving the comparison incomplete and the response without a developed body. The relationship between the two stated extremes is not explained, and there are no further details to guide the reader through the age groups. Build a clear sequence: introduce what the chart compares, summarise the main trends, then group and compare the figures. Use linking expressions only when the following idea is fully stated.
Lexical Resource: Band 4.5
The response uses some task-relevant vocabulary, including “percentage,” “trend,” and “physical activity,” so the topic is generally recognisable. However, several choices are inaccurate or unnatural: “ratio” is not the right term for values shown as percentages, “Several generations” is an imprecise description of age groups, and “the higest trend” does not naturally describe a peak figure. There are also spelling and capitalisation slips, including “australian,” “Several,” and “higest.” Use precise chart language and check spelling: for example, refer to “the proportion of Australian men and women” and say a figure “was highest” or “peaked.”
Grammatical Range and Accuracy: Band 4.5
The response attempts a complex overview sentence with a contrast between female and male figures, but grammatical control is uneven. In “The chart illustrate,” the singular subject requires “illustrates”; “the percentage of female … showed” also has an unclear and incomplete grammatical relationship. The phrase “between 2010” uses an unsuitable preposition for a single year, and the final “In contrast,” is left without a clause. Most of the writing relies on short, simple structures, so there is little evidence of a controlled range. Practise complete comparison sentences, such as “The female figure peaked at 53.3% among 45–54-year-olds, whereas the male figure was highest at 52.8% among those aged 15–24.”
See this exact question answered at other band scores. The same prompt compared across bands.
Browse more IELTS Writing model answers or get your own writing scored by the same AI examiner.