Band 6.5 IELTS Writing Task 1 Model Answer
Overall Band Score: 6.5 · Cambridge IELTS 12 · 2026-11-16
IELTS Writing Task 1 question
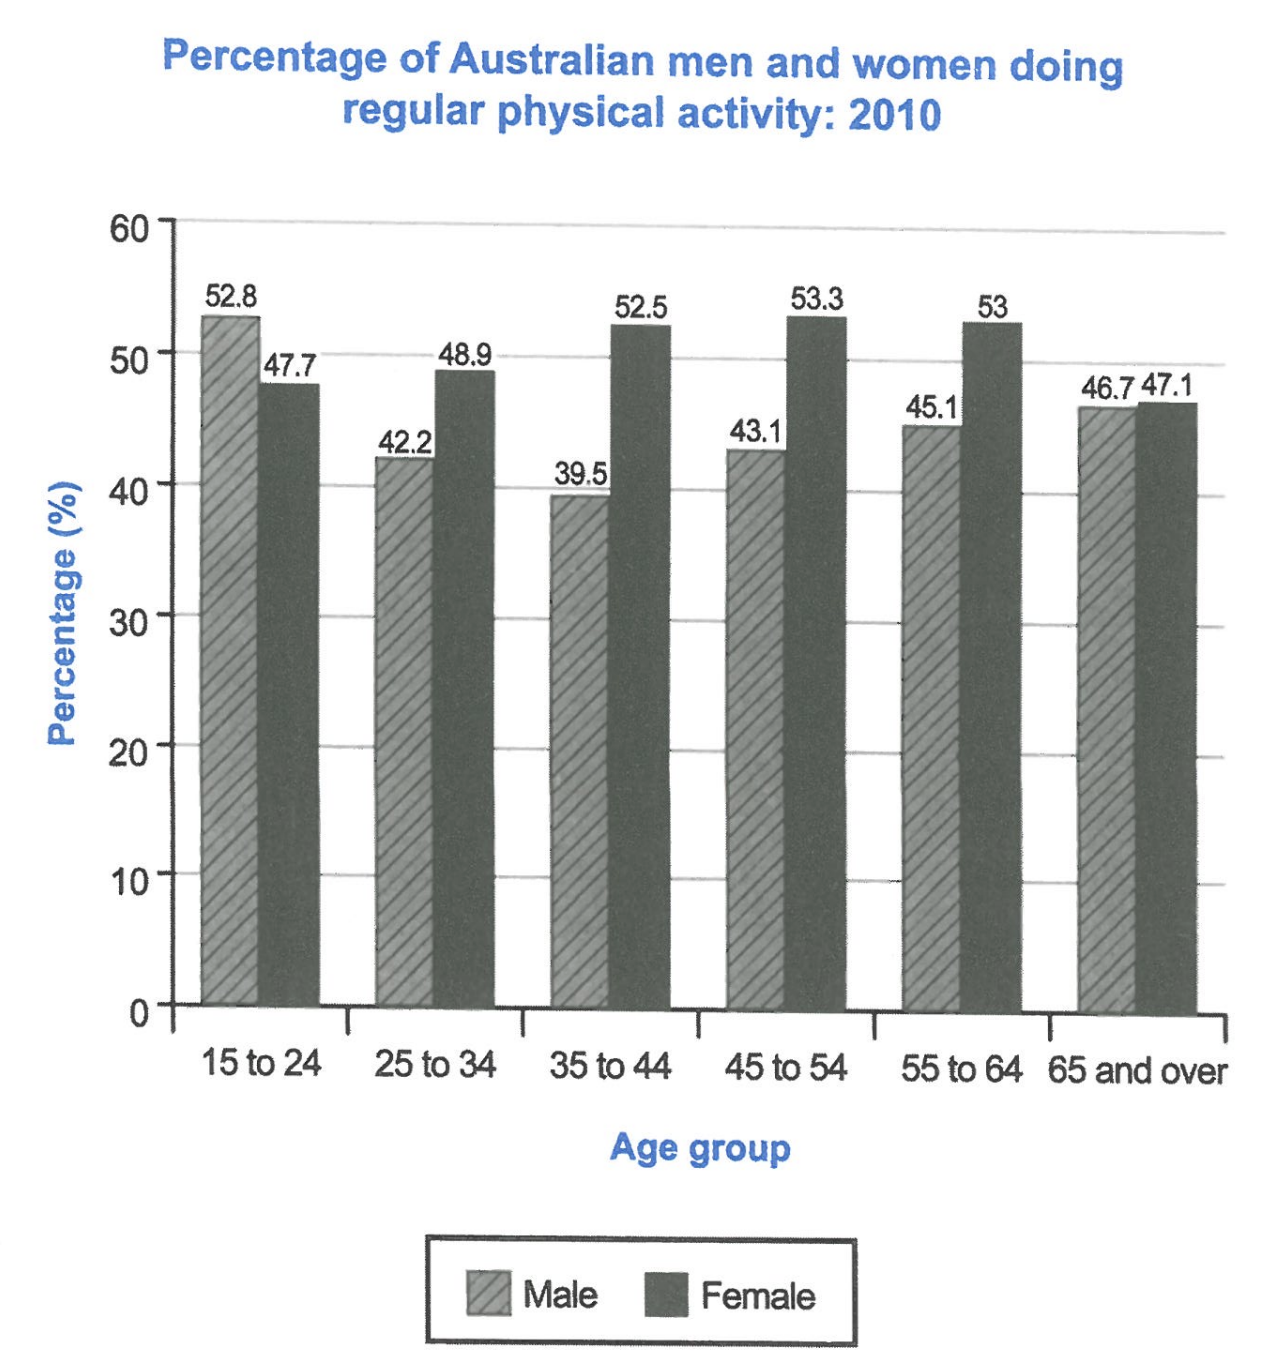
The bar chart below shows the percentage of Australian men and women in different age groups who did regular physical activity in 2010.
Summarise the information by selecting and reporting the main features, and make comparisons where relevant.
Student answer (Band 6.5)
The bar chart illustrates the percentage of Australian men and women in six different age groups who did regular physical activity in 2010.
Overall, it is clear that female dominated in every age group than men except for group aged 15 to 24. 65 and over is the only age group where the figures were almost identical.
To begin with, in the age group 15 to 24, men accounted for 52.8%, compared to women at 47.7%. In contrast, participation in fitness for males declined to 42.2% for group 25 to 34, whereas 48.9% females participated in fitness. A similar pattern is seen for group aged 35 to 44, where male participation stood at 39.5% and females at 52.5%.
Turning to the remaining data, people aged 45 to 54, physical workout in men accounted for 43.1% and females rose to 53.3% making it the highest participation group for females. In group 55 to 64, male participation climbed to 45.1% and female contribution dropped to 53%. Finally, people aged 65 and over accounted for relatively similar figures at 46.7% males and 47.1% females.
AI examiner evaluation
| Criterion | Band |
|---|---|
| Task Achievement / Task Response | 6.5 |
| Coherence and Cohesion | 6.5 |
| Lexical Resource | 6.5 |
| Grammatical Range and Accuracy | 6.0 |
| Overall | 6.5 |
Task Achievement / Task Response: Band 6.5
You cover the chart’s main comparisons and include accurate figures across all six age groups. The overview identifies the key pattern: women recorded higher participation in every group except ages 15–24, while the oldest group had nearly equal rates. You also correctly identify the female peak at 45–54 and describe the male decline followed by a recovery. This gives the response a clear, relevant summary. To make the account more fully developed, sharpen the overview by noting that women’s rates were comparatively steady, while men’s varied more markedly. Some descriptions, such as “people aged 45 to 54,” are less direct than naming the male and female figures, so keep the comparisons explicit throughout.
Coherence and Cohesion: Band 6.5
The response is arranged in a clear sequence: an introduction, an overview, and two paragraphs covering the age groups. Phrases such as “In contrast,” “A similar pattern,” and “Finally” help readers follow the comparisons, and the progression from younger to older groups is logical. This is a coherent overall structure. However, some linking is a little mechanical, with repeated age-group openings and transitions such as “Turning to the remaining data.” The sentence beginning “Turning to the remaining data, people aged 45 to 54…” also makes the relationship between the introductory phrase and the main clause awkward. Vary the way you group related figures and use clearer references to the male and female rates to make cohesion more natural.
Lexical Resource: Band 6.5
You use an adequate range of chart-related vocabulary, including “accounted for,” “declined,” “stood at,” “climbed,” and “relatively similar.” These choices help report figures and trends without making the meaning difficult to understand. There are, however, some imprecise or unnatural collocations: “female dominated” is not a natural way to describe higher rates, “participated in fitness” is less suitable than language about physical activity, and “female contribution” does not accurately describe a participation rate. “Physical workout” is also an awkward substitute for the chart’s activity measure. Prefer precise, consistent terms such as “participation rate” and “the proportion of men/women who exercised”; this would improve control and reduce unnecessary variation.
Grammatical Range and Accuracy: Band 6.0
You use a mix of simple statements and more complex comparisons, including clauses with “whereas” and “compared to,” and most of the figures remain easy to understand. Some grammatical errors persist, however. In the overview, “female dominated in every age group than men” has an incorrect comparative construction; write, for example, “women had higher rates than men in every age group except…” The sentence “65 and over is the only age group where the figures were almost identical” shifts awkwardly between present and past tense. In “Turning to the remaining data, people aged 45 to 54, physical workout in men accounted for 43.1%,” the sentence structure is incomplete or misassembled. Check that each sentence has a clear subject and verb, and keep tense consistent when describing the 2010 data.
See this exact question answered at other band scores. The same prompt compared across bands.
Browse more IELTS Writing model answers or get your own writing scored by the same AI examiner.