Band 5.0 IELTS Writing Task 1 Model Answer
Overall Band Score: 5.0 · Cambridge IELTS 12 · 2026-11-17
IELTS Writing Task 1 question
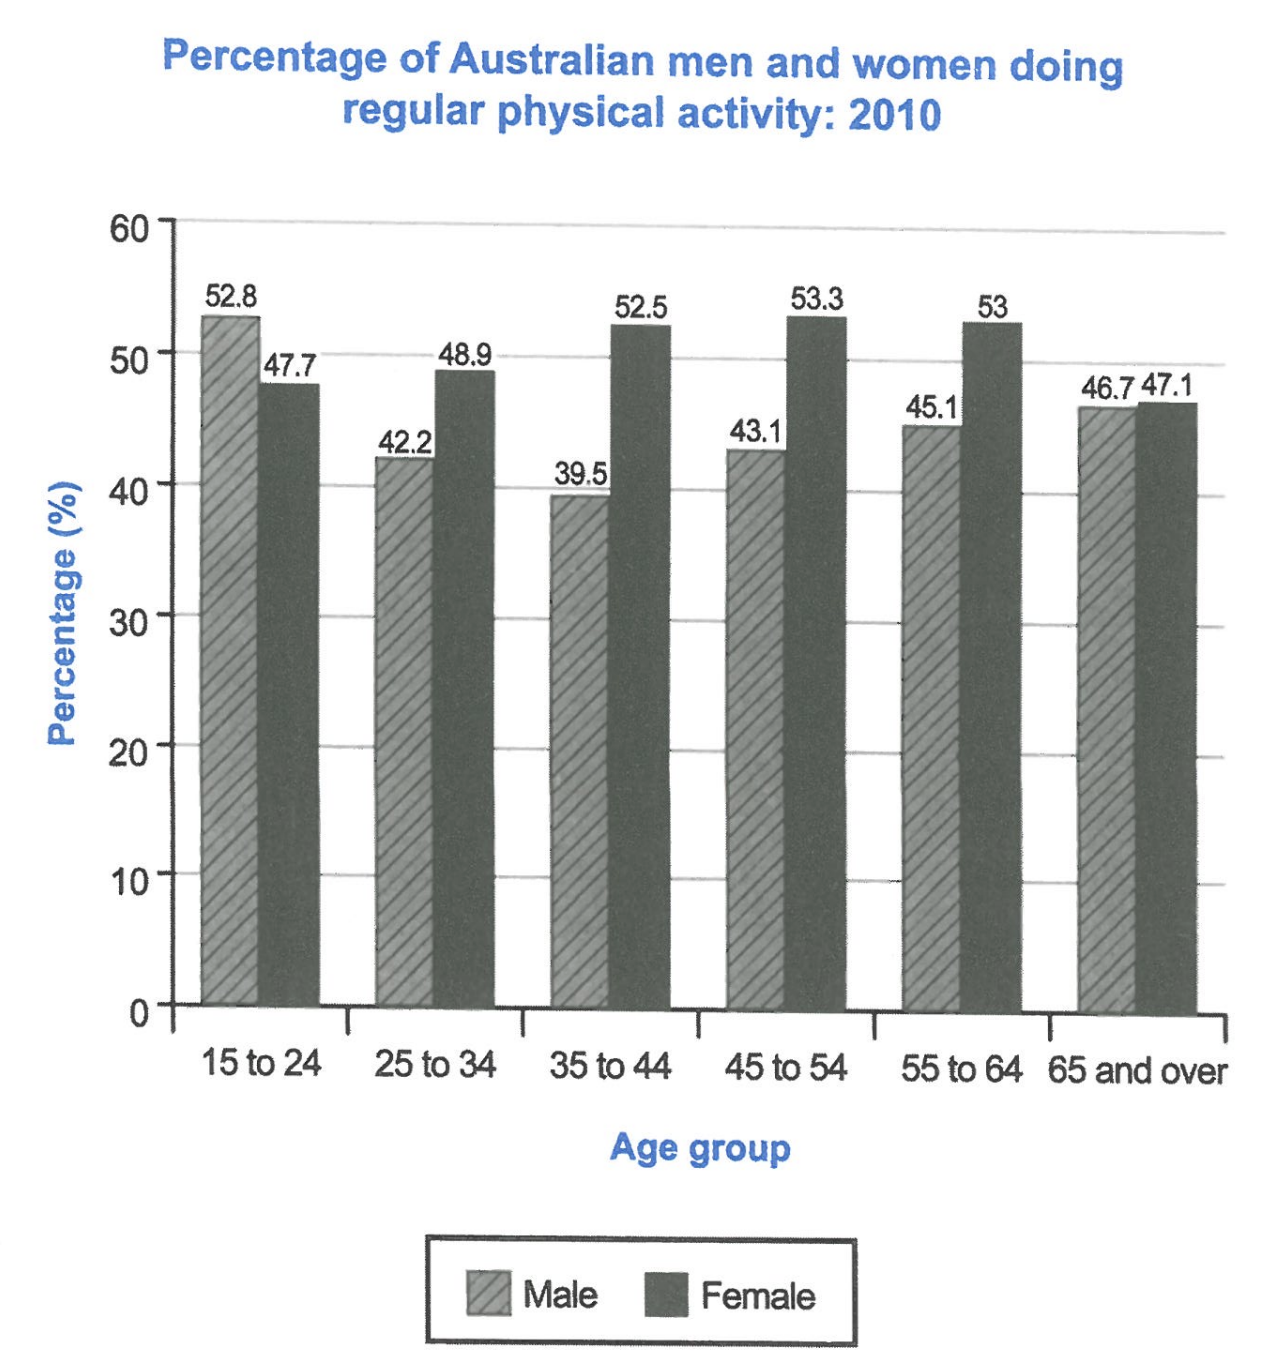
The bar chart below shows the percentage of Australian men and women in different age groups who did regular physical activity in 2010.
Summarise the information by selecting and reporting the main features, and make comparisons where relevant.
Student answer (Band 5.0)
The bar chart illustrate the percentage of Australian men and women in different age groups who did regular physical activity in 2010.
overall we can view that women had doing regularly most physical activity rather than men , there are percentage of average group men and women.
To start with, male the age of 15 to 24 there was highest physical activities man do regularly by 52.8% . women was 47.7% do regular activity in age of 15 to 24 ,while, compare with boys the girls had less physical activity, 25 to 34 age adult men had 42.2 % and women had 48.9% however, the age of 35 to 44
middle adult the boys had 39.5% and girls had 52.5 % regular activities doing in 2010.
In age of 45 to 54 old adult the men had 43.1% doing regular activities and 53.3% women doing regular activity in 2010 which had the highest percentage. 55 to 64 ads group of men had 45.1% and human had 53% , 65 and over elder men was doing 46.7% people regularly exercise and and the 65 and over age women was 47.1% activities . in the old age women doing more physical exercise than men.
AI examiner evaluation
| Criterion | Band |
|---|---|
| Task Achievement / Task Response | 5.5 |
| Coherence and Cohesion | 5.0 |
| Lexical Resource | 5.0 |
| Grammatical Range and Accuracy | 4.5 |
| Overall | 5.0 |
Task Achievement / Task Response: Band 5.5
You include figures from all six age groups and make relevant comparisons, such as men leading among 15–24-year-olds and women recording higher rates in most other groups. The overview that women were generally more active is broadly supported. However, it is not fully clear or accurate: men had the higher rate only in the youngest group, while women led in each of the remaining five groups. The claim that 53.3% was the highest percentage needs qualification: it was the highest female figure, but the overall maximum was the men’s 52.8% only if comparing? In fact, 53.3% is the chart’s highest value. More importantly, the overview does not identify the main pattern that men’s rate fell to a low at 35–44 before rising, while women’s peaked at 45–54. A clearer overview and more selective reporting would strengthen the response.
Coherence and Cohesion: Band 5.0
The response has a basic structure: an introduction, a brief overview, and details arranged by age group. This gives the reader a general route through the chart, and comparisons such as the 25–34 figures are attempted. However, progression is often difficult to follow because several age groups and comparisons are packed into long, loosely connected sentences. For example, the sentence beginning “To start with” moves from the youngest group to 25–34 and then 35–44 without clear sentence boundaries. Linking words such as “however” and “while” are sometimes used awkwardly, and the final sentence repeats the general comparison rather than adding a clear concluding feature. Use one paragraph for the overview and group the data into shorter, logically connected comparisons.
Lexical Resource: Band 5.0
You use some relevant chart vocabulary, including “percentage,” “age group,” “highest,” and “regular activity,” so the topic is generally understandable. However, the range is limited and several word choices or collocations are inaccurate enough to make parts of the report awkward. Examples include “women had doing regularly most physical activity,” “average group,” “middle adult,” and “human had 53%.” The repeated use of “boys” and “girls” is also unsuitable for adult age groups; “men” and “women” are more precise. There is some repetition of “regular activity” and “doing,” rather than varied, accurate reporting language. Build a small set of reliable terms such as “participation rate,” “recorded,” “stood at,” and “exceeded,” and use them consistently.
Grammatical Range and Accuracy: Band 4.5
You attempt comparisons and longer sentences, but control of sentence structure and verb forms is inconsistent, and many sentences contain errors that make the relationships between figures harder to follow. For example, “The bar chart illustrate” has subject–verb disagreement, while “women had doing” uses an incorrect verb construction. The sentence beginning “To start with, male the age of 15 to 24” lacks a clear grammatical structure, and the long sequence of age groups is joined without reliable punctuation. Articles and plural forms are also often missing or inconsistent. These problems fit a limited range with frequent errors, although the figures and basic comparisons can usually still be understood. Practise accurate simple comparison sentences before combining them with clauses.
See this exact question answered at other band scores. The same prompt compared across bands.
Browse more IELTS Writing model answers or get your own writing scored by the same AI examiner.