Band 5.5 IELTS Writing Task 1 Model Answer
Overall Band Score: 5.5 · Cambridge IELTS 12 · 2026-11-18
IELTS Writing Task 1 question
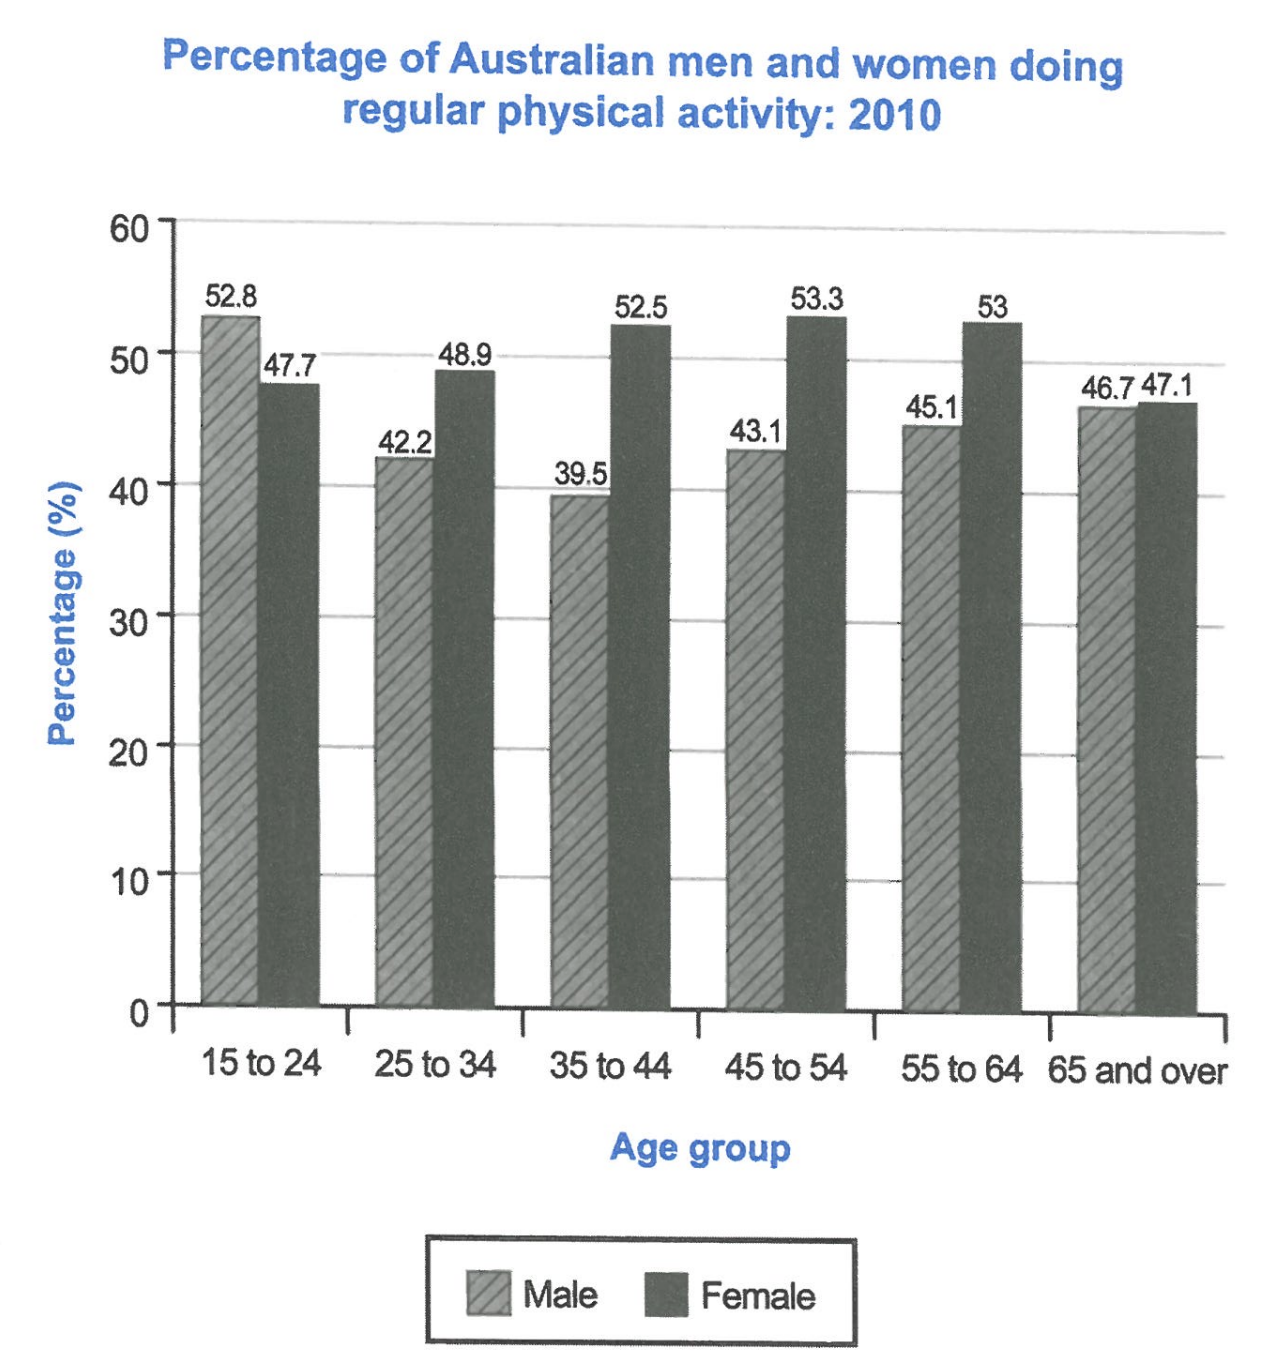
The bar chart below shows the percentage of Australian men and women in different age groups who did regular physical activity in 2010.
Summarise the information by selecting and reporting the main features, and make comparisons where relevant.
Student answer (Band 5.5)
INTRODUCTION :
The chart shows the percentage of Australian men and women of different age groups who did regular physical activity in 2010.
Analyisis :
The chart bar tells us females of age 45 to 54 top the chart at 53.8 % while males of age 35 to 44 hold the lowest position ( 39.5% ).
Paragraph 1 :
According to the chart, for males, the age 15 to 24 had the highest percentage doing exercise regularly at 52.8 % but gradullay decreases to 42.2 % for age group 25 to 34 and then 39.5 % for age group 35 to 44. But for females , the age group 15 to 24 had the percentage of 47.7% which gradullay increases to 48.9% for group 25 to 34 and then to 52.5% for group 35 to 44.
Paragraph 2 :
The chart shows , the males of age group 45 to 54 had the percentage of 43.1% which incresses steadily to 45.1 % for age group 55 to 64 and then 46.7% for males of age 65 and above. But for females , the age group 45 to 54 has the percentage of 53.3 % which goes down to 53 for group 55 to 64 and then 47.1 for 65 and above females.
AI examiner evaluation
| Criterion | Band |
|---|---|
| Task Achievement / Task Response | 5.5 |
| Coherence and Cohesion | 5.5 |
| Lexical Resource | 5.5 |
| Grammatical Range and Accuracy | 5.5 |
| Overall | 5.5 |
Task Achievement / Task Response: Band 5.5
You identify the chart’s subject and report several relevant figures, including the male low of 39.5% and the female peak of 53.3% in the 45–54 group. However, the overview says the female peak is 53.8%, which does not match the chart, and it does not summarise the main overall pattern: men start higher in the youngest group, while women have higher participation in every other age group. The body paragraphs describe the age-group figures, but the response is mainly a sequence of data rather than a clear selection and comparison of the key features. State the overall contrast accurately, then use figures to support it.
Coherence and Cohesion: Band 5.5
The response has a recognisable structure, with an introduction, an overview-like statement, and separate paragraphs for the two halves of the age range. This helps the reader follow the figures. However, the labels “INTRODUCTION,” “Analyisis,” and “Paragraph 1” are unnecessary, and the progression is weakened by repeated sentence openings such as “The chart shows” and repeated “But for females.” Comparisons between men and women are mostly presented in separate sequences rather than directly linked. Organise the body around clear comparisons—for example, contrast the sexes in the younger groups, then in the older groups—and use linking phrases selectively to make the relationships between figures clearer.
Lexical Resource: Band 5.5
You use relevant vocabulary for describing chart data, including “percentage,” “highest,” “lowest,” “increases,” and “goes down,” so the meaning is generally understandable. However, the range is limited and some expressions are informal or imprecise for an academic report: “top the chart,” “hold the lowest position,” and “the chart bar tells us” could be replaced with more conventional reporting language. There are also noticeable spelling errors, including “Analyisis,” “gradullay,” and “incresses,” which reduce accuracy. Aim for precise terms such as “recorded,” “reached,” and “declined,” and check spelling carefully before submitting.
Grammatical Range and Accuracy: Band 5.5
You attempt both simple and longer sentences, and the main figures are usually expressed in understandable clauses. However, sentence control is uneven, particularly in the long sentences joined with “but” and “and then.” For example, “for males, the age 15 to 24 had the highest percentage” has an awkward grammatical construction, while “the age group 45 to 54 has the percentage” shifts into the present tense despite describing 2010 data. Punctuation and spacing around commas and percentages are also inconsistent. Use a consistent past tense, form comparisons with clear subjects (for example, “the figure for men aged 15–24”), and divide long sequences into controlled sentences.
See this exact question answered at other band scores. The same prompt compared across bands.
Browse more IELTS Writing model answers or get your own writing scored by the same AI examiner.