Band 5.5 IELTS Writing Task 1 Model Answer
Overall Band Score: 5.5 · Cambridge IELTS 12 · 2026-11-19
IELTS Writing Task 1 question
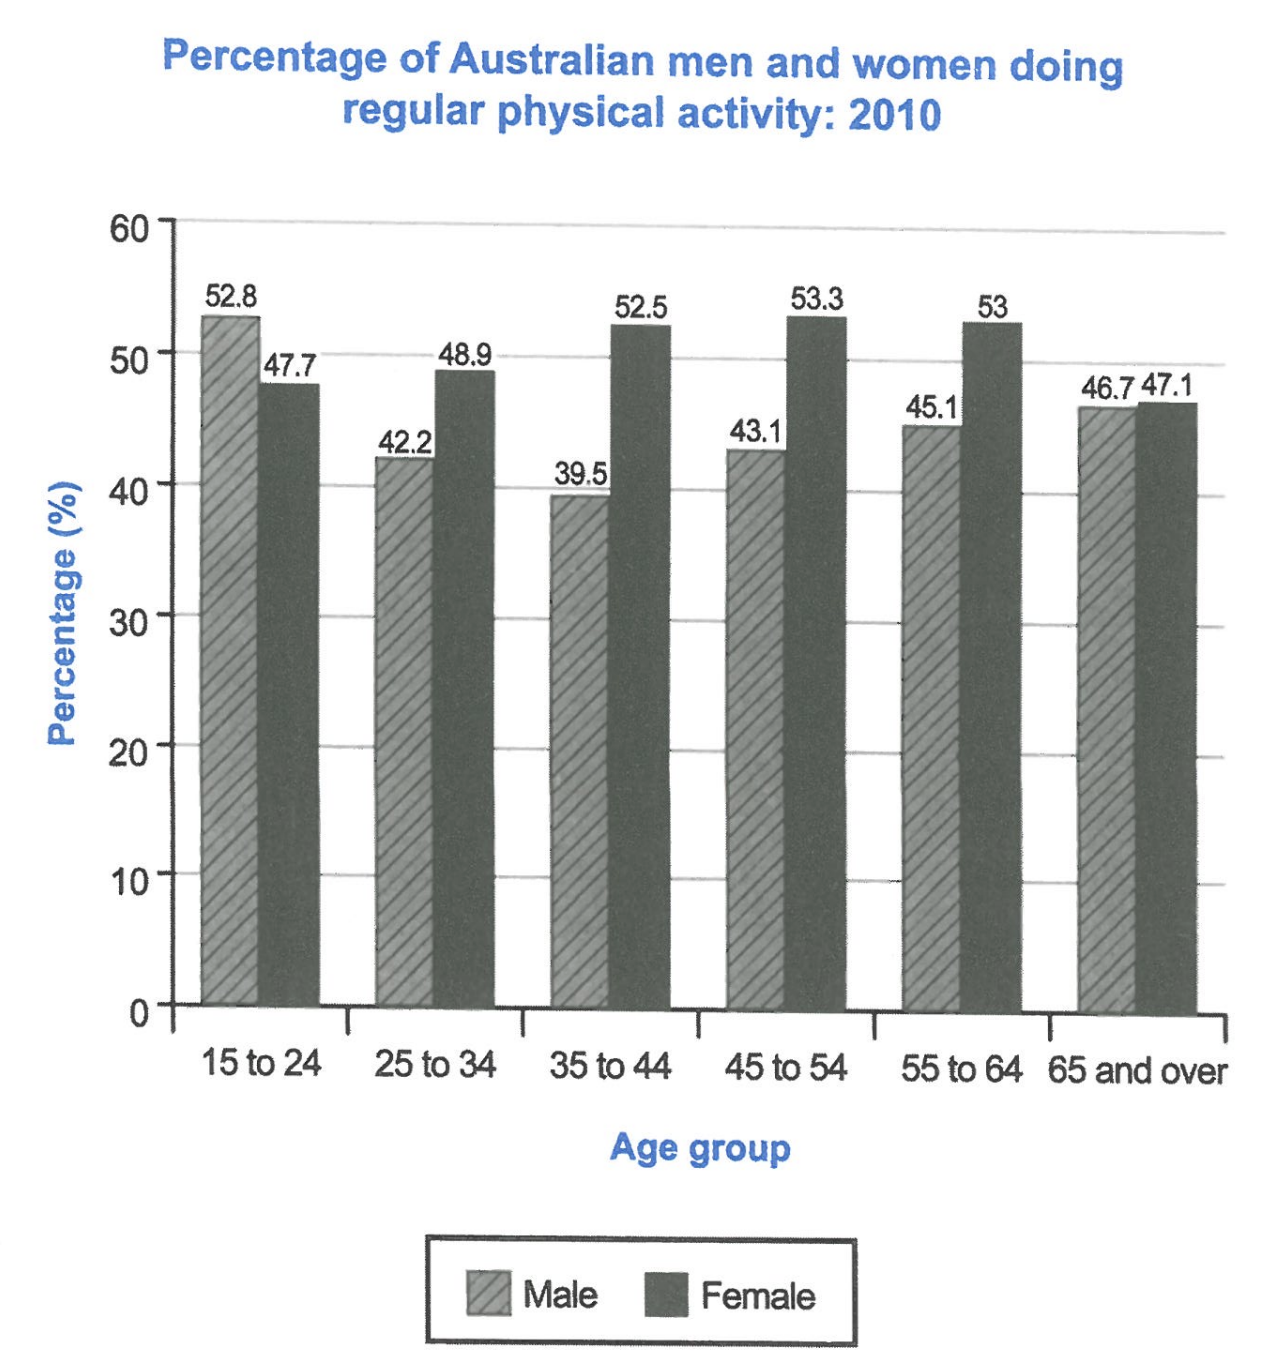
The bar chart below shows the percentage of Australian men and women in different age groups who did regular physical activity in 2010.
Summarise the information by selecting and reporting the main features, and make comparisons where relevant.
Student answer (Band 5.5)
The following chart illustrates the percentage of Australian men and women across six different age groups who participated in regular physical activity in 2010.
Overall, it is evident that women were more physically active than men in almost all age groups.The only exception was the youngest group, where men recorded a higher participation rate. The figures for both genders became almost identical in odest age category. The highest female participation was 53.3% and the lowest was around 47.1% and also the lowest male participation was 39.5% and the higest one is around 52.8% which was mentioned in the very start.
Regarding men, the figure started at 52.8% among those aged 15-24 and for the female it was 47.7 for the same aged. And the ending was around 46.7% for the male and 47.1% for female of the aged group around 65 and over. Therefore, the following graph proves that women of all the ages were working more than the men irrespective of the aged group of 15-24.
AI examiner evaluation
| Criterion | Band |
|---|---|
| Task Achievement / Task Response | 5.5 |
| Coherence and Cohesion | 5.5 |
| Lexical Resource | 5.5 |
| Grammatical Range and Accuracy | 5.5 |
| Overall | 5.5 |
Task Achievement / Task Response: Band 5.5
You identify the main contrast—that women had higher activity rates in most age groups, while men led among 15–24-year-olds—and include several accurate figures, such as 52.8% for young men and 53.3% for women aged 45–54. However, the overview is weakened by saying the rates were almost identical in the oldest group without explaining that women were slightly higher, and by later claiming women were more active at every age except the youngest, which is not supported by the chart’s full pattern as presented. The response also gives little account of the middle age groups, where the gender gap changes and women’s rate peaks. Select and compare these key trends more clearly, and ensure the summary does not contradict itself or the data.
Coherence and Cohesion: Band 5.5
The response has a recognisable structure: an introduction, an overview, and a paragraph with figures. This gives the reader some sense of organisation, and phrases such as “Regarding men” signal a shift in focus. However, progression is limited because the final paragraph mainly repeats the opening and closing figures rather than developing comparisons across the age groups. The overview also combines several points in a long sequence, and the conclusion, “Therefore, the following graph proves,” does not add a useful summary. Some linking is awkward or unclear, including “which was mentioned in the very start.” Group related comparisons together—for example, the youngest group, the middle-age peak, and the oldest group—and use concise references to avoid repetition.
Lexical Resource: Band 5.5
You use relevant task vocabulary, including “participation rate,” “age groups,” and “physically active,” so the topic is generally clear. There is also some variation in how you describe the chart, such as “illustrates” and “recorded.” However, the range is limited and several choices are inaccurate or unnatural: “the very start” is vague, “working more” does not mean doing more physical activity, and “irrespective of the aged group” is an unsuitable phrase here. Spelling errors such as “odest” and “higest” are noticeable, while “the female” and “the male” sound less natural than “women” and “men.” Use precise terms such as “rate,” “proportion,” and “activity levels,” and check spelling and collocations.
Grammatical Range and Accuracy: Band 5.5
You attempt both simple and more extended sentence forms, including “The only exception was the youngest group, where men recorded a higher participation rate.” Most of the intended meaning can be followed, but errors in sentence boundaries, agreement, articles, and phrasing make the writing less controlled. For example, there is no space after the full stop in “groups.The,” and “the highest female participation was 53.3% and the lowest was around 47.1% and also the lowest male participation…” joins several ideas without clear punctuation. In “for the female it was 47.7 for the same aged,” the structure is incomplete and the comparison is difficult to read. Practise separating comparisons into complete sentences and checking articles, plural forms, and punctuation.
See this exact question answered at other band scores. The same prompt compared across bands.
Browse more IELTS Writing model answers or get your own writing scored by the same AI examiner.