Band 5.0 IELTS Writing Task 1 Model Answer
Overall Band Score: 5.0 · Cambridge IELTS 12 · 2026-11-19
IELTS Writing Task 1 question
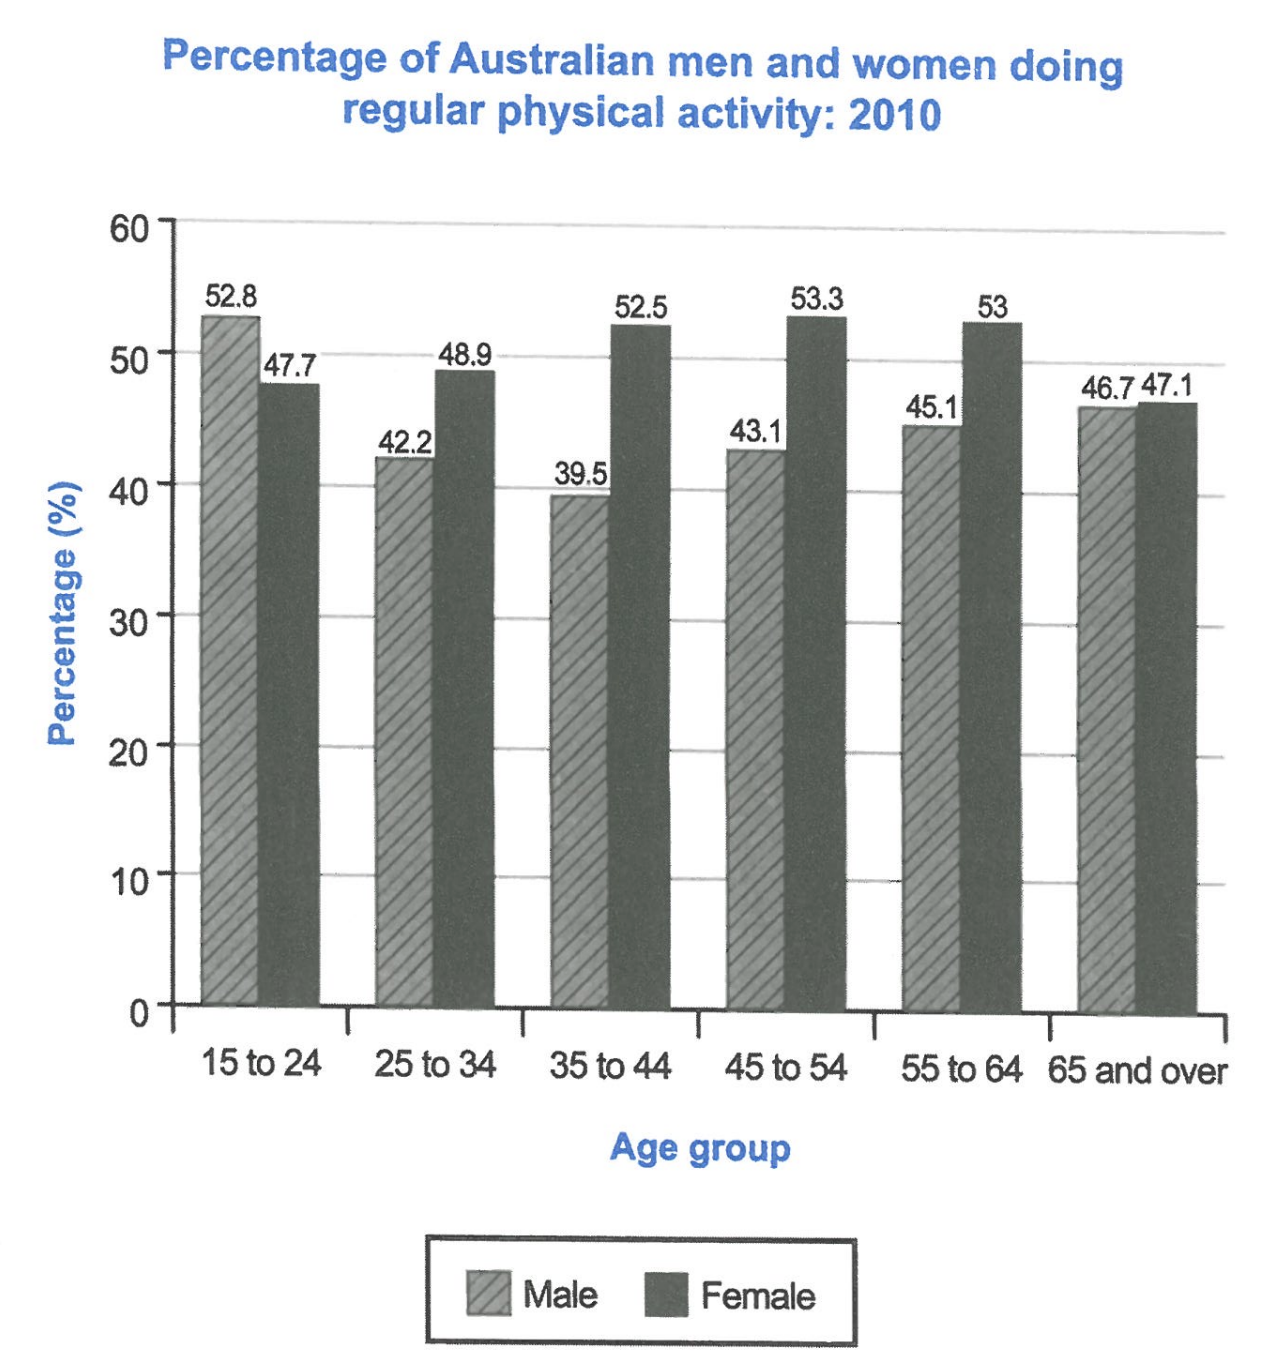
The bar chart below shows the percentage of Australian men and women in different age groups who did regular physical activity in 2010.
Summarise the information by selecting and reporting the main features, and make comparisons where relevant.
Student answer (Band 5.0)
The bar chart compares the percentage of Australian men and women in different age groups who did regular physical activity in 2010.
Firstly, we can see that, there are different age group is given such as 15 to 24, 25 to 34 and other. People whose age were in 15 to 24 age group were doing physical activity near 50%, where male have 52.8% and female have 47.7% which is the nearly similar with women who older than 65 or more. People whose age group was 25 to 34 are less likely interested in physical activity the reason behind this men were had low percentage compare to other groups. Men who belonged in age group 35 to 44 had lowest percentage. Lastly, People who belonged in age groups such as 45 to 54 and 55 to 64 had similar percentage of regular physical activity.
Overall, we can conclude, men whose age were between 15 and 24 had highest percentage of physical activity and women who belonged in the age group 45 to 54 had highest percentage of regular physical activity.
AI examiner evaluation
| Criterion | Band |
|---|---|
| Task Achievement / Task Response | 5.0 |
| Coherence and Cohesion | 5.0 |
| Lexical Resource | 5.5 |
| Grammatical Range and Accuracy | 5.0 |
| Overall | 5.0 |
Task Achievement / Task Response: Band 5.0
You identify the chart’s subject and report some relevant comparisons, including the male peak among 15–24-year-olds and the female peak among 45–54-year-olds. However, the response only partially selects and summarises the main features. The overview misses the central pattern that women recorded higher activity than men in every age group except 15–24, and it incorrectly says women aged 45–54 had the highest rate overall; the female figure is slightly higher at 35–44 (53.3% versus 53.0%). Several statements are vague, such as saying the 45–54 and 55–64 groups had “similar percentage,” without clarifying the sex comparison. Focus on accurate overall trends and support them with key figures.
Coherence and Cohesion: Band 5.0
The response has a basic structure, beginning with an introduction and ending with an overall statement, and it uses sequencing words such as “Firstly” and “Lastly.” These features help the reader recognise the topic and some stages of the discussion. However, there is no clear progression through the data: the body moves between age groups and sexes without a consistent comparison, and the final overview repeats selected peaks rather than synthesising the main pattern. Some linking is mechanical, while “the reason behind this” introduces an explanation that the chart does not provide. Group the figures logically—for example, describe the male trend and then the female trend—and use clear references to connect comparisons.
Lexical Resource: Band 5.5
You use relevant chart vocabulary, including “percentage,” “age group,” “regular physical activity,” and “highest,” so the topic is generally clear. There is also some attempt to vary phrasing with expressions such as “less likely” and “belonged in.” However, several choices are awkward or imprecise, including “interested in physical activity,” which suggests motivation rather than participation, and “near 50%,” which is less precise than a chart description requires. Repetition of “People whose age group” also limits flexibility. Choose concise, conventional reporting language and use terms such as “rate,” “proportion,” “recorded,” and “participation” accurately to make comparisons clearer.
Grammatical Range and Accuracy: Band 5.0
The response attempts some longer sentence forms, including clauses beginning “where” and “who,” and the main message is usually understandable. However, the range is limited and complex attempts often contain errors. For example, “there are different age group is given” has faulty agreement and sentence structure, while “men were had low percentage” combines incompatible verb forms. Other problems include “People whose age were” and “Overall, we can conclude,” where agreement and punctuation are not controlled. These errors recur and sometimes make relationships between ideas difficult to follow. Practise accurate simple comparisons first, then build longer sentences with controlled relative clauses and consistent past-tense reporting.
See this exact question answered at other band scores. The same prompt compared across bands.
Browse more IELTS Writing model answers or get your own writing scored by the same AI examiner.