Band 6.5 IELTS Writing Task 1 Model Answer
Overall Band Score: 6.5 · Cambridge IELTS 12 · 2026-11-20
IELTS Writing Task 1 question
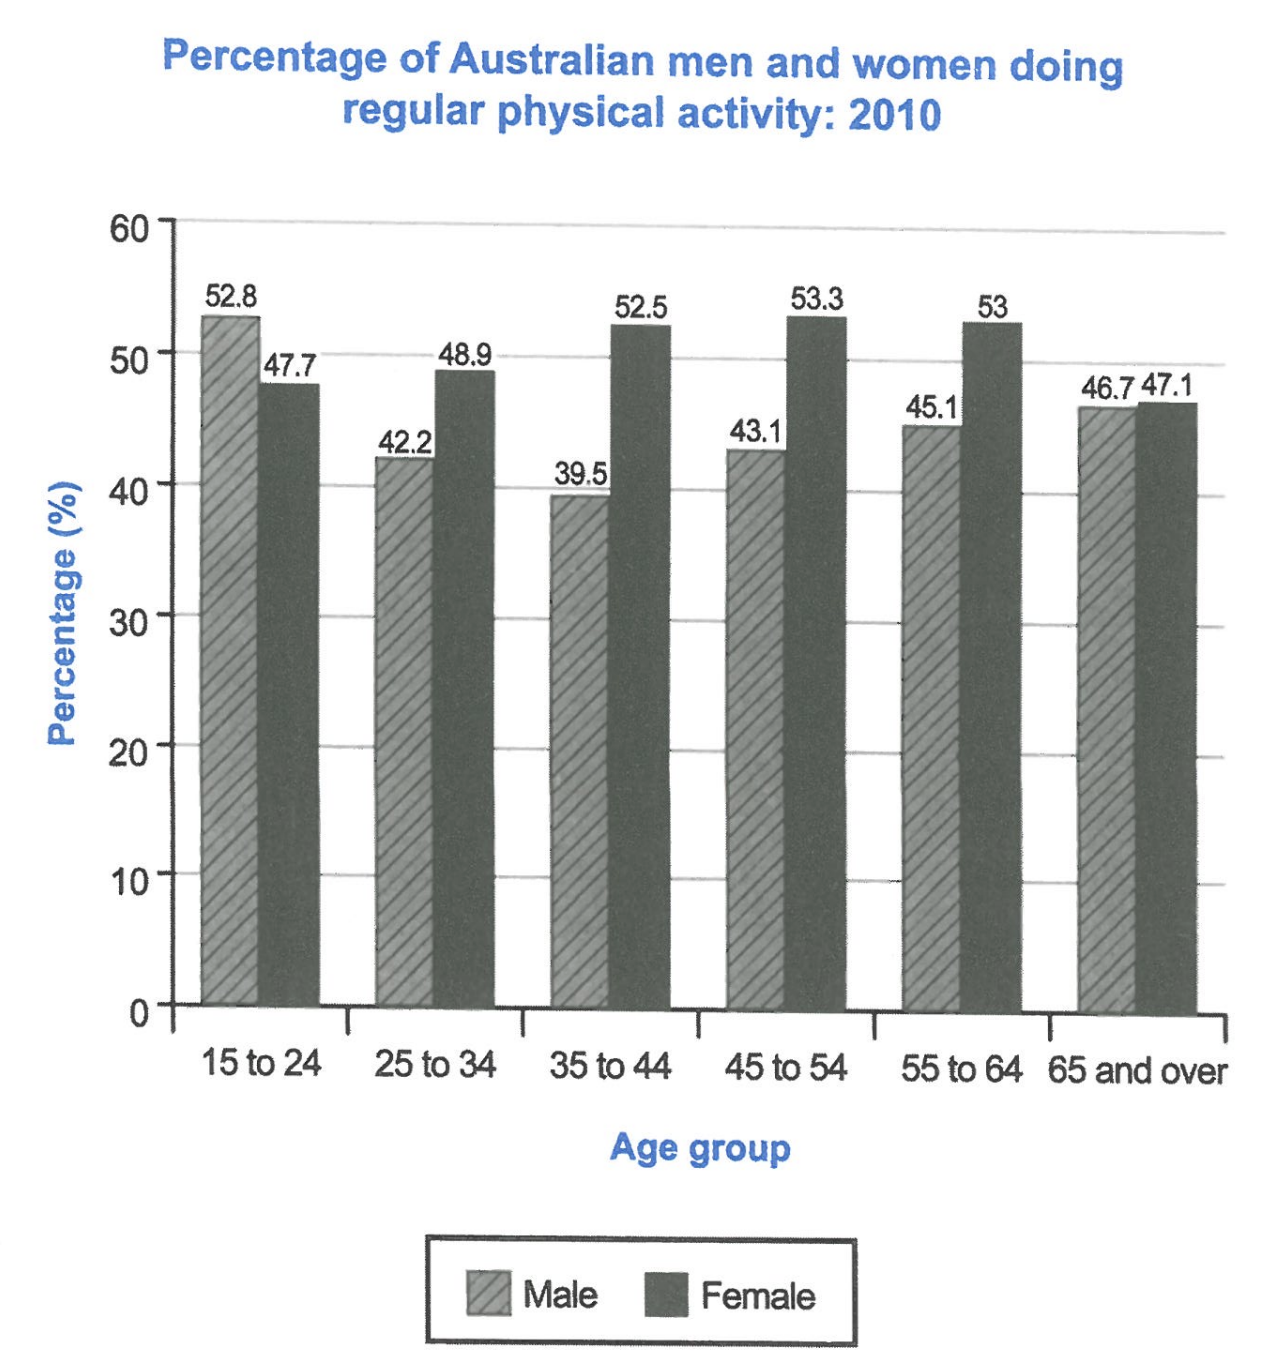
The bar chart below shows the percentage of Australian men and women in different age groups who did regular physical activity in 2010.
Summarise the information by selecting and reporting the main features, and make comparisons where relevant.
Student answer (Band 6.5)
The bar chart compares the proportions of male and female in diffderent age groups who did physical exercise regularly in Australia in the year 2010.
Overall, more men are tended to do regular activity then female at very young age. After 25 years of age, the percentages of men who did regular activity were always lesser than female. However, after 65 years old the proportion of men and women became almost same.
Between 15 and 24 years, 52.8% male did regular axecise and the figure for female was 47.7%, almost 5% lesser then male figure. However, this is the only age group where the proportion of male was higher than female. Among the age of 25 to 34, the figures for male and female were 42.2% and 48.9% respectively. In the next age group (35 to 44), the proportion of man slightly decreased to 39.5%, making it the lowest figure among all age groups, while the figure of female rose to 52.5%.
The proportion of men and women were 43.1% and 53.3% respectively, whos age is between 45 and 54, this is the highest figure for female among all age groups. In next age group (55 to 64), 45.1% men did regular exercise and the proportion of female was 53%. However, the proportions of male and female whos age is 65 and above were very close, 46.7% and 47.1% respectively.
AI examiner evaluation
| Criterion | Band |
|---|---|
| Task Achievement / Task Response | 7.0 |
| Coherence and Cohesion | 6.5 |
| Lexical Resource | 6.0 |
| Grammatical Range and Accuracy | 5.5 |
| Overall | 6.5 |
Task Achievement / Task Response: Band 7.0
You give a clear overview of the main patterns: men lead only in the youngest group, women lead in the other age groups, and the figures are nearly equal among those aged 65 and over. The reported values are accurate, and you identify useful extremes, including the lowest male figure at 35–44 and the highest female figure at 45–54. This makes the response well focused and supported with relevant data. To strengthen the report further, make the overall trends more precise: for example, male participation falls to 35–44 before rising, while female participation rises to 45–54 and then declines. The phrase “After 25 years of age” is also slightly imprecise because the comparison concerns age groups beginning at 25.
Coherence and Cohesion: Band 6.5
The response is arranged in a clear sequence: an introduction, an overview, and then details moving through the age groups. This gives the reader a coherent account, and linking expressions such as “However,” “while,” and “In the next age group” help connect comparisons. The organisation is effective overall, though some transitions feel repetitive or mechanical, particularly the repeated “In next age group” pattern. The sentence beginning “The proportion of men and women were 43.1% and 53.3% respectively” also places the age information awkwardly, making the relationship between the figures and the 45–54 group less smooth. Use a wider range of comparison-led transitions and keep each sentence’s subject and reference clear to make the progression more fluent.
Lexical Resource: Band 6.0
You use an adequate range of task-related vocabulary, including “proportions,” “figure,” “regular exercise,” and “respectively,” and the meaning is generally clear. There are also attempts to vary wording, such as “the proportion” and “the figure.” However, several word-choice and collocation problems reduce precision: “more men are tended to do” is not a natural way to describe the chart, and “almost 5% lesser” should express a difference in percentage points more accurately. Spelling slips such as “diffderent,” “axecise,” and “whos” also affect control. Aim for consistent, natural chart language—for example, “the percentage of men who exercised regularly”—and check spelling and comparative expressions carefully.
Grammatical Range and Accuracy: Band 5.5
You attempt a mix of simple and complex sentences, including clauses with “while” and “making it the lowest figure,” and the reader can follow the main comparisons. However, some grammatical errors recur across the response. For example, “more men are tended” has an incorrect verb construction, while “the proportion of men and women were” has subject–verb disagreement. There are also problems with articles and number, as in “52.8% male,” and the sentence “The proportion … respectively, whos age is between 45 and 54” is structurally awkward. These errors do not usually prevent understanding, but they limit accuracy. Practise forming comparisons with a clear subject and verb, and check agreement and sentence structure when combining figures with age-group details.
See this exact question answered at other band scores. The same prompt compared across bands.
Browse more IELTS Writing model answers or get your own writing scored by the same AI examiner.