Band 6.0 IELTS Writing Task 1 Model Answer
Overall Band Score: 6.0 · Cambridge IELTS 12 · 2026-11-20
IELTS Writing Task 1 question
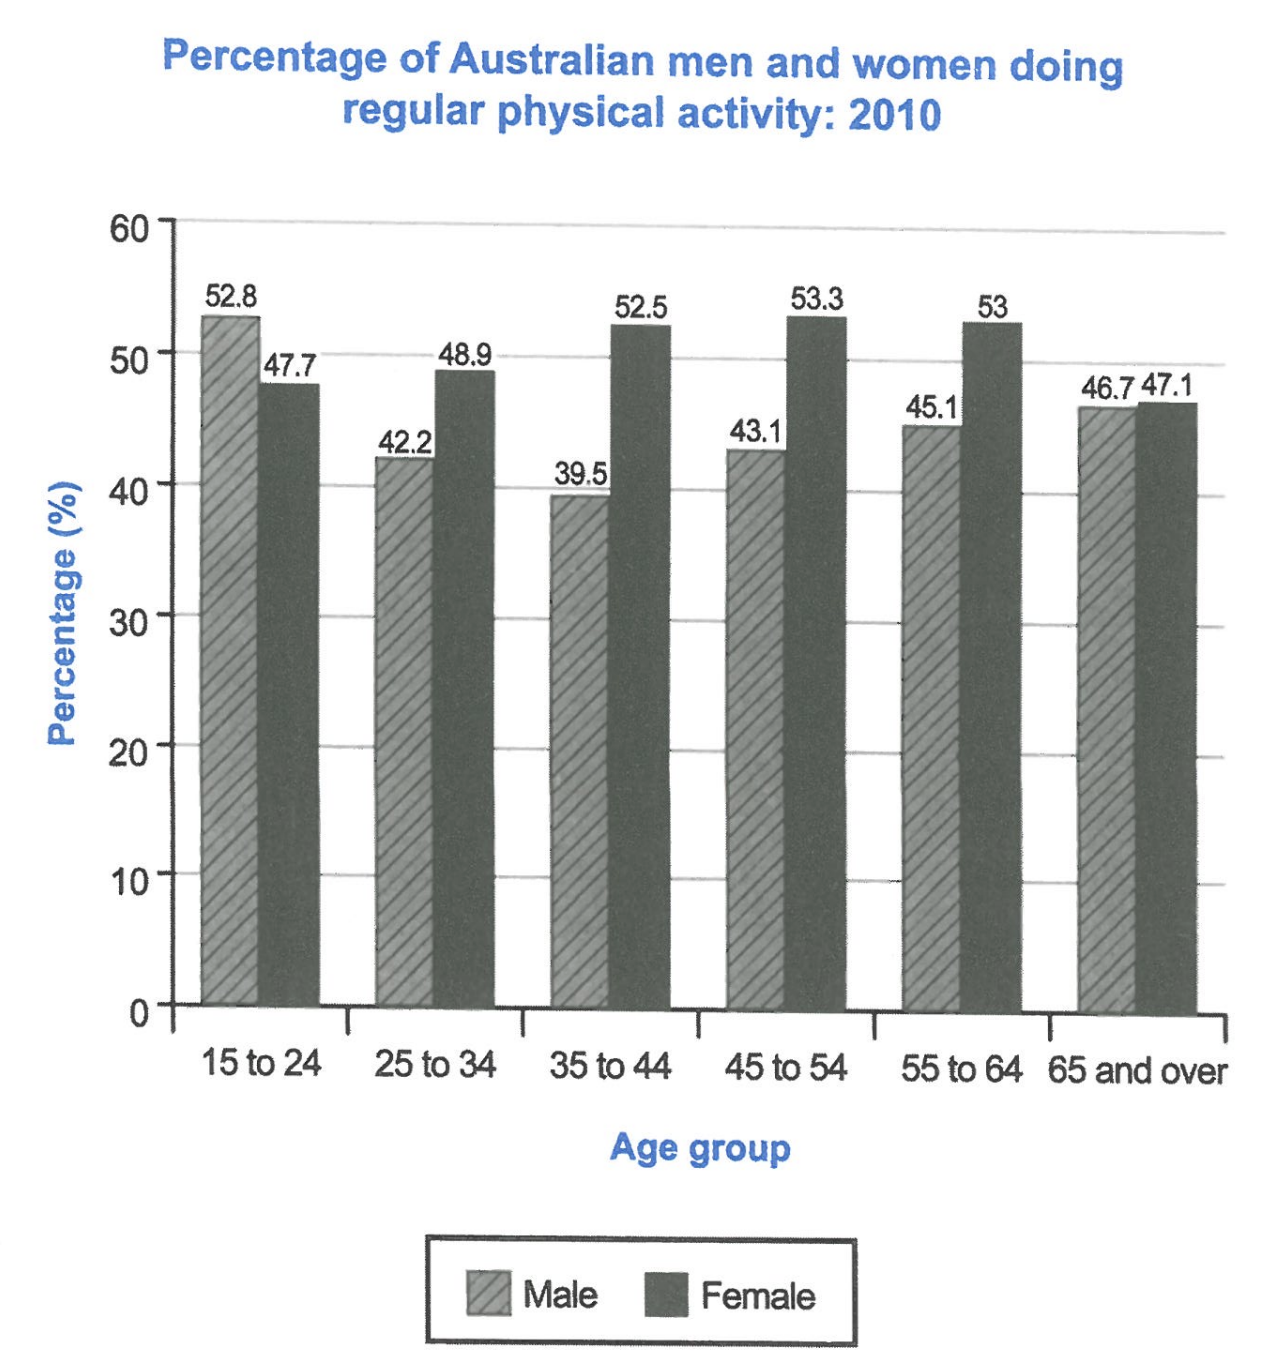
The bar chart below shows the percentage of Australian men and women in different age groups who did regular physical activity in 2010.
Summarise the information by selecting and reporting the main features, and make comparisons where relevant.
Student answer (Band 6.0)
The bar chart illustrates the percentage of Australian men and women of varied age ranges who did regular physical exercise in 2010.
Overall, it shows that women had the highest percentage in most of the age groups, and at later age had almost similar percentage with men. Meanwhile, mean had the lowest percent compared to women in most of the age ranges.
There was a notable difference between men and women at age 15 to 24, with men having 52.8 and women 47.7 percent. At age 25 to 34 the men had a decrease in the percentage against women, with men having 42.2 while women had 48.9. Between the age range of 35 to 44 and 55 to 64, women maintained a relatively similar percentage ranging from 52.5, 53 and 53.3. Whereas the men dropped at 35 to 44, and kept increasing little by little at 45 to 54 and 55 to 64.
There was almost similar percentage between men and women, at 65 and over, with men having 46.7 and women 47.1.
AI examiner evaluation
| Criterion | Band |
|---|---|
| Task Achievement / Task Response | 5.5 |
| Coherence and Cohesion | 6.5 |
| Lexical Resource | 6.0 |
| Grammatical Range and Accuracy | 5.5 |
| Overall | 6.0 |
Task Achievement / Task Response: Band 5.5
You identify the main overall pattern: women recorded higher activity rates in most age groups, while the sexes were close among those aged 65 and over. Several key figures are also reported accurately, including the 15–24 and 25–34 comparisons and women’s rates across the middle age groups. However, the overview is not fully precise: men were higher only in the youngest group, not simply lower in “most” groups without noting this exception clearly. The account also omits the important peak for women at 45–54 and the overall low point for men at 35–44, and the description of the male trend could be more exact. Select and summarise the main highs, lows, and changes more explicitly.
Coherence and Cohesion: Band 6.5
The response has a clear overall arrangement, moving from an introduction and overview to age-specific comparisons, and the final paragraph usefully isolates the oldest group. Linking expressions such as “Meanwhile,” “Whereas,” and “There was” help signal relationships between points. This coherent progression meets the lower-band expectations and shows some stronger organisation. However, cohesion is occasionally mechanical, with repeated sentence openings such as “There was” and repeated references to “percentage.” The sentence beginning “Between the age range…” also combines several age groups and trends in a way that makes the comparison less easy to follow. Use more varied referencing and organise the body around clear contrasts, such as the youngest group, the middle-age trends, and the oldest group.
Lexical Resource: Band 6.0
You use an adequate range of task-related vocabulary, including “illustrates,” “notable difference,” “maintained,” and “ranging from,” so the chart’s subject and comparisons are generally clear. There are also attempts to describe change rather than merely list figures. Some word choices and collocations are inaccurate or awkward, however: “at later age,” “mean had the lowest percent,” and “kept increasing little by little” do not express the intended comparisons naturally. “Mean” is especially confusing because it can refer to an average rather than men. Aim for precise chart language and consistent terms such as “men,” “rate,” “rose,” and “declined.” These improvements would make the adequate vocabulary more accurate and flexible.
Grammatical Range and Accuracy: Band 5.5
You attempt both simple and more complex sentence forms, including clauses introduced by “with” and “whereas,” and the main comparisons are usually understandable. However, some grammatical errors remain and occasionally make relationships less clear. For example, “women had the highest percentage in most of the age groups, and at later age had almost similar percentage with men” lacks clear parallel structure and articles. “At age 25 to 34 the men had a decrease” is an awkward construction, while “Between the age range … women maintained” creates an incomplete or poorly connected sentence before “Whereas.” Work on articles, plural forms, and complete clause structure, and check that contrast clauses are attached to a main clause. More consistently accurate complex sentences would strengthen the response.
See this exact question answered at other band scores. The same prompt compared across bands.
Browse more IELTS Writing model answers or get your own writing scored by the same AI examiner.