Band 6.0 IELTS Writing Task 1 Model Answer
Overall Band Score: 6.0 · Cambridge IELTS 12 · 2026-11-20
IELTS Writing Task 1 question
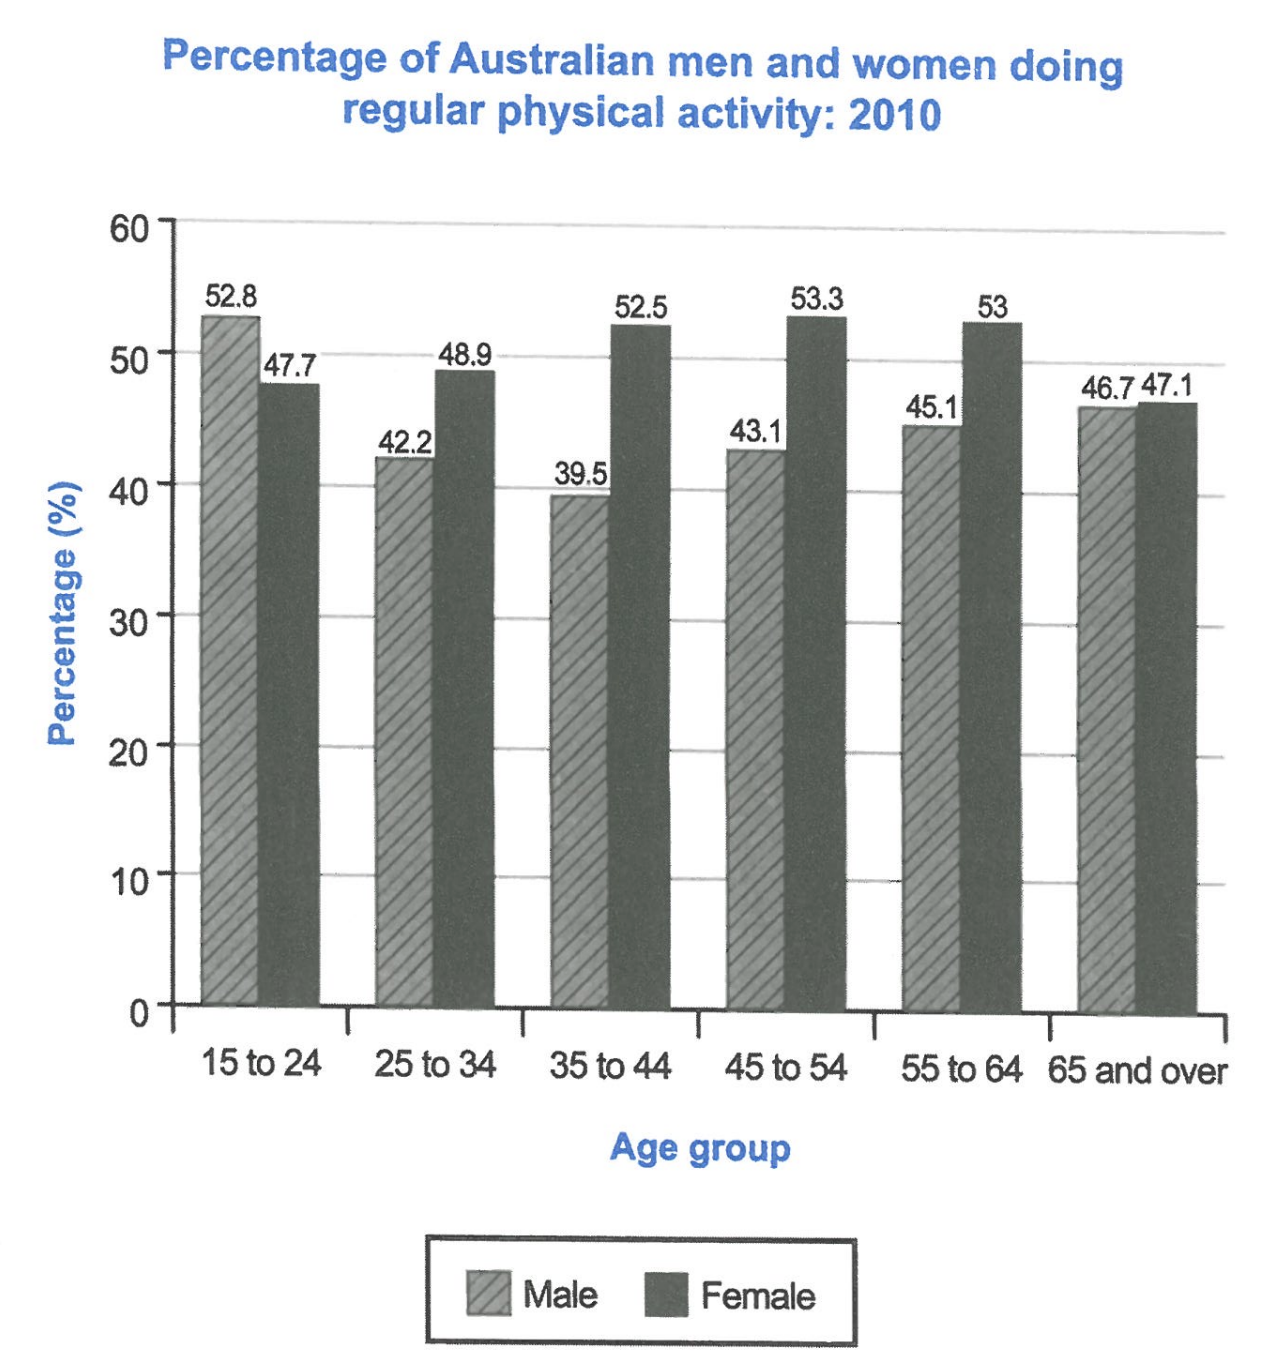
The bar chart below shows the percentage of Australian men and women in different age groups who did regular physical activity in 2010.
Summarise the information by selecting and reporting the main features, and make comparisons where relevant.
Student answer (Band 6.0)
The bar chart illustrates the percentage of Australian age group of men and women who did regular physical activity in 2010.
Overall, women were more physically active then men in most of the age group. The highest proportion of women was recorded among age group of 45 to 54, while the highest figure of men was 15 to 24 years old.
In the age group of 15-24, about 53% of men participated in regular physical activity, compared with women approximately 48%. In the people aged between 25 to 34 a higher percentage of females exercised regulary compared to males, at approximately 49% and 42% respectively. Similary, the proportion of males participating in regular exercise at the age 35 to 44, 45 to 54, and 55 to 64 was remained below 50% standing at roughly 40%, 43%and 45% with their age group.
Furthermore, the proportion of females in these same age brackets accounted for hust over half, which was 52%, 54% and 53% respectively. Then women generally had higher partcipation rates then men particullary in middle- aged groups.
AI examiner evaluation
| Criterion | Band |
|---|---|
| Task Achievement / Task Response | 6.0 |
| Coherence and Cohesion | 6.0 |
| Lexical Resource | 6.0 |
| Grammatical Range and Accuracy | 5.5 |
| Overall | 6.0 |
Task Achievement / Task Response: Band 6.0
You identify the main overall contrast: men lead in the youngest group, while women have higher activity rates in the other five groups. You also report several relevant figures, including the male peak of about 53% at ages 15–24 and the female peak of about 53% at 45–54. However, some details are less fully or precisely presented. The overview says women’s highest rate was in the 45–54 group, but does not mention that their figures remain around 47–53% and then fall in the oldest group. The final comparison is also general, and the male figure for ages 65 and over is omitted. Develop the overview to capture the broad trends across both sexes and include the final age group for a more complete summary.
Coherence and Cohesion: Band 6.0
The response has a clear overall arrangement: an introduction, an overview, and two paragraphs presenting age-group comparisons. The progression from the youngest group to the middle groups is easy to follow, and linking expressions such as “Overall,” “Furthermore,” and “Then” help signal relationships. However, some cohesion is mechanical or unclear. “These same age brackets” requires the reader to connect back to the three groups in the previous paragraph, while “Then women generally…” does not clearly show how the concluding point follows from the figures. The long sentence beginning “Similarly” also combines several age groups and figures in a way that makes the comparison harder to track. Use clearer references and separate the data into more controlled comparisons.
Lexical Resource: Band 6.0
You use an adequate range of task-related vocabulary, including “proportion,” “participated,” “physically active,” and “participation rates.” These choices allow you to describe the chart and compare the sexes. There are, however, some inaccurate word choices, collocations, and spelling errors. “The proportion … accounted for just over half” is not a natural way to report a percentage, and “at the age 35 to 44” is imprecise. Spelling errors such as “regulary,” “Similary,” “partcipation,” and “particullary” are noticeable, although the intended meaning is generally clear. Aim for precise chart language such as “the rate stood at” or “the figure was,” and proofread carefully for spelling.
Grammatical Range and Accuracy: Band 5.5
You attempt both simple and more complex sentence forms, including comparisons with “compared with” and a sentence beginning “while.” Most of the data remains understandable, but some grammatical errors recur. In the introduction, “the percentage of Australian age group” needs a plural or possessive construction, and “then men” should be “than men.” The phrase “the proportion of males … was remained below 50%” has an incorrect verb form; use “remained below 50%.” There are also problems with articles and prepositions in “among age group of 45 to 54” and “at the age 35 to 44.” Punctuation and spacing around figures are inconsistent. More accurate control of these patterns, alongside varied sentence structures, would strengthen the response.
See this exact question answered at other band scores. The same prompt compared across bands.
Browse more IELTS Writing model answers or get your own writing scored by the same AI examiner.