Band 6.0 IELTS Writing Task 1 Model Answer
Overall Band Score: 6.0 · Cambridge IELTS 12 · 2026-11-21
IELTS Writing Task 1 question
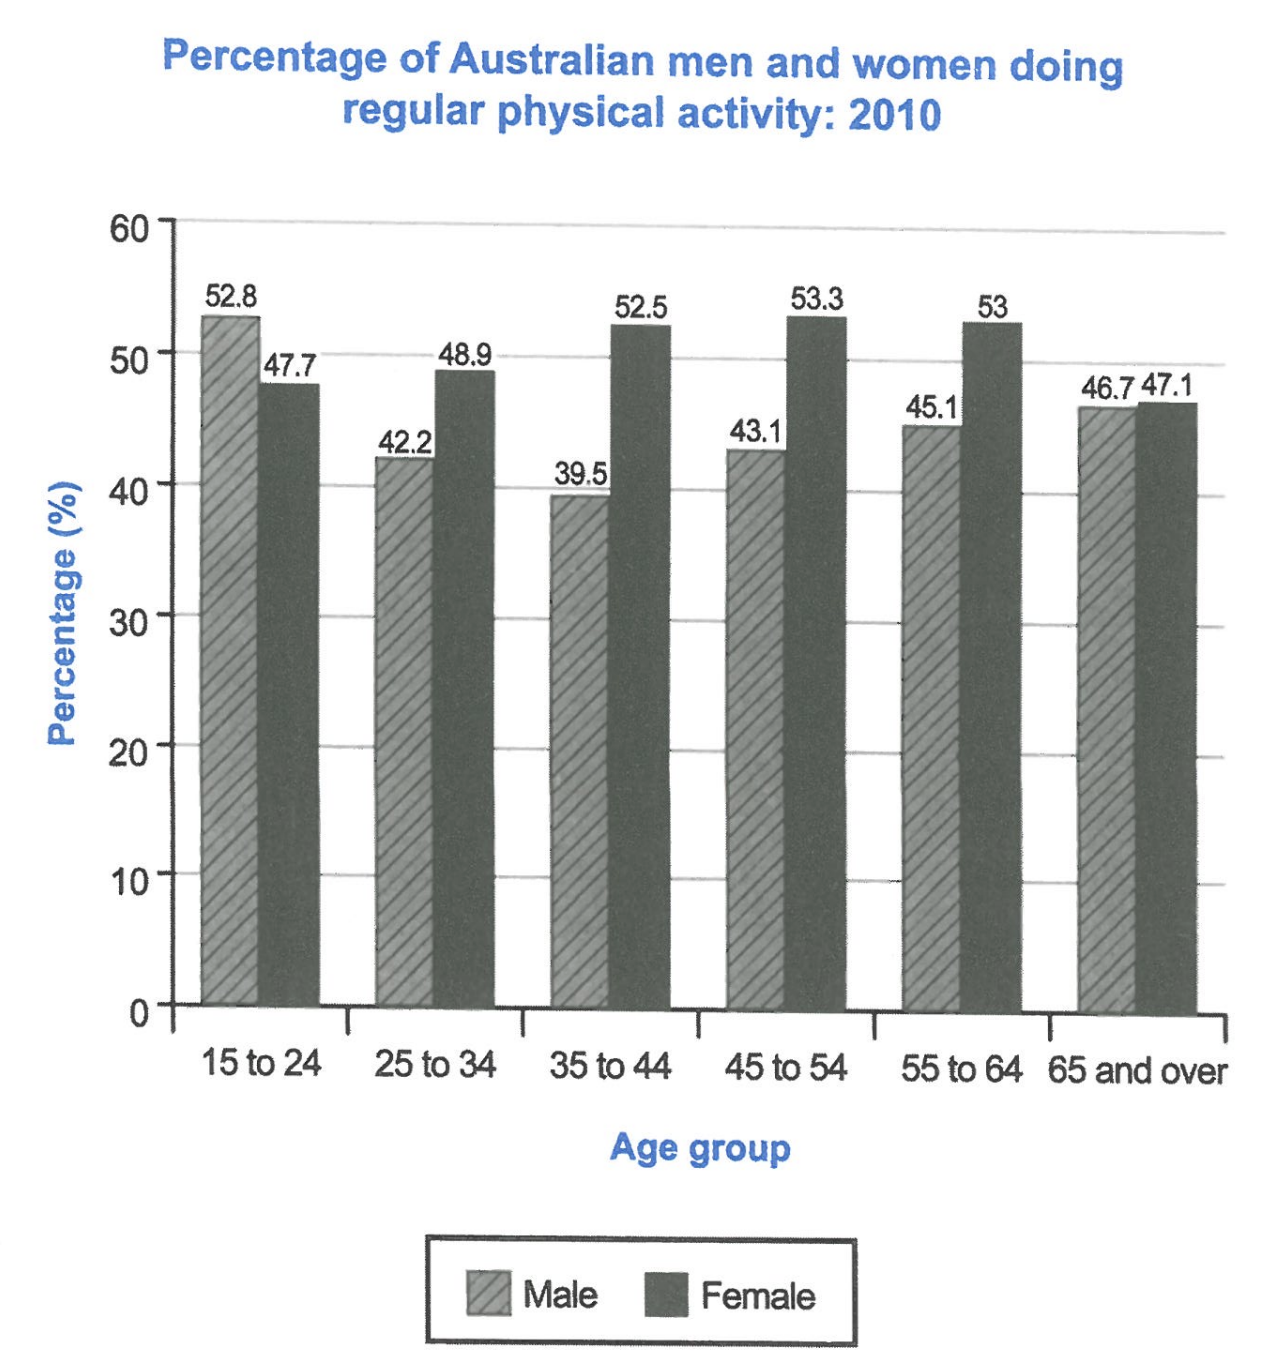
The bar chart below shows the percentage of Australian men and women in different age groups who did regular physical activity in 2010.
Summarise the information by selecting and reporting the main features, and make comparisons where relevant.
Student answer (Band 6.0)
The bar chart illustrates the proportion of Australian men and women doing constant physical activity in various age groups in 2010.
Overall, in all age groups except young people (between the age of 15 and 24), females surpassed male in terms of regular physical activity. Highest activity in females were seen in the age of 45 to 54, and for males were in between 15 and 24. As for the proportion who did the lowest activity were the group of 35 to 44 (men) and 65 or over 65 (women)
Men around 15 to 24 years old have the highest (52.8%) tendency towards regular physical activity. which fell to 42.2% (around the age of 25 to 34) and 39.5% (in the age of 35 to 44). After that drop, the figures started to rise gradually and by the last age group (65 and over), it was 46.7%.
For the females, it started at 47.7% (around the age of 15 to 24) and constantly increased to 48.9% (in the age of 25 to 34) and 52.5% in the age group of 35 to 44. The numbers had some stability (to be exact 53.3% and 53%) over the following ages till it dropped to 47.1% by the age of 65 or over.
AI examiner evaluation
| Criterion | Band |
|---|---|
| Task Achievement / Task Response | 6.5 |
| Coherence and Cohesion | 6.5 |
| Lexical Resource | 6.0 |
| Grammatical Range and Accuracy | 5.5 |
| Overall | 6.0 |
Task Achievement / Task Response: Band 6.5
You give a clear overview of the main contrasts: men lead only in the youngest group, while women lead in the other five, and you identify the male low point and female peak. Most figures in the body are accurately reported, including the male fall to 39.5% and the female rise to 53.3%. This covers the task well, though some details in the overview are imprecise: women’s lowest figure is in the 65-and-over group, but the male maximum is better described as the highest rate rather than a “tendency.” Also, the female figures are described as stable, although they edge down from 53.3% to 53.0% before the final decline. A more precise overview and sharper comparison of the overall patterns would strengthen the response.
Coherence and Cohesion: Band 6.5
The response is arranged in a sensible sequence: an introduction, an overview, then separate descriptions of the male and female data. This makes the information easy to follow, and phrases such as “After that drop” help signal changes over time. However, some linking and reference choices are awkward or unclear. The overview’s sentence beginning “As for the proportion who did the lowest activity” is difficult to connect to the preceding comparison, and “it” in the final paragraph could refer to either the figure or the activity rate. The abrupt lowercase “which” after a full stop also interrupts the flow. More controlled sentence boundaries and clearer references would make the progression smoother and less mechanical.
Lexical Resource: Band 6.0
You use an adequate range of vocabulary for describing chart data, including “proportion,” “surpassed,” “gradually,” “increased,” and “dropped.” These choices help communicate the main trends, and the meaning remains clear. Some less suitable word choices and collocations limit precision, however: “constant physical activity” does not naturally convey regular exercise, “tendency towards” is not the right phrase for a percentage, and “the numbers had some stability” is awkward. “Highest activity … were seen” also uses an unnatural construction. Aim for standard chart language such as “participation rate,” “was highest,” and “remained relatively stable.” This would make the description more precise and natural without requiring a more elaborate vocabulary.
Grammatical Range and Accuracy: Band 5.5
You attempt a mix of simple and more complex structures, including comparisons and clauses describing changes, and the main information is generally understandable. Some grammatical errors remain, particularly with agreement, sentence boundaries, and phrasing. For example, “Highest activity in females were seen” has a subject–verb agreement problem, while “which fell to 42.2%” begins with a lowercase letter after a full stop and is left as a fragment. The overview phrase “As for the proportion who did the lowest activity were the group” also has an incomplete, mismatched structure. There are further issues with articles and number, as in “in all age groups … females surpassed male.” Check that each sentence has a clear subject and verb, and proofread agreement and punctuation.
See this exact question answered at other band scores. The same prompt compared across bands.
Browse more IELTS Writing model answers or get your own writing scored by the same AI examiner.