Band 5.0 IELTS Writing Task 1 Model Answer
Overall Band Score: 5.0 · Cambridge IELTS 12 · 2026-11-21
IELTS Writing Task 1 question
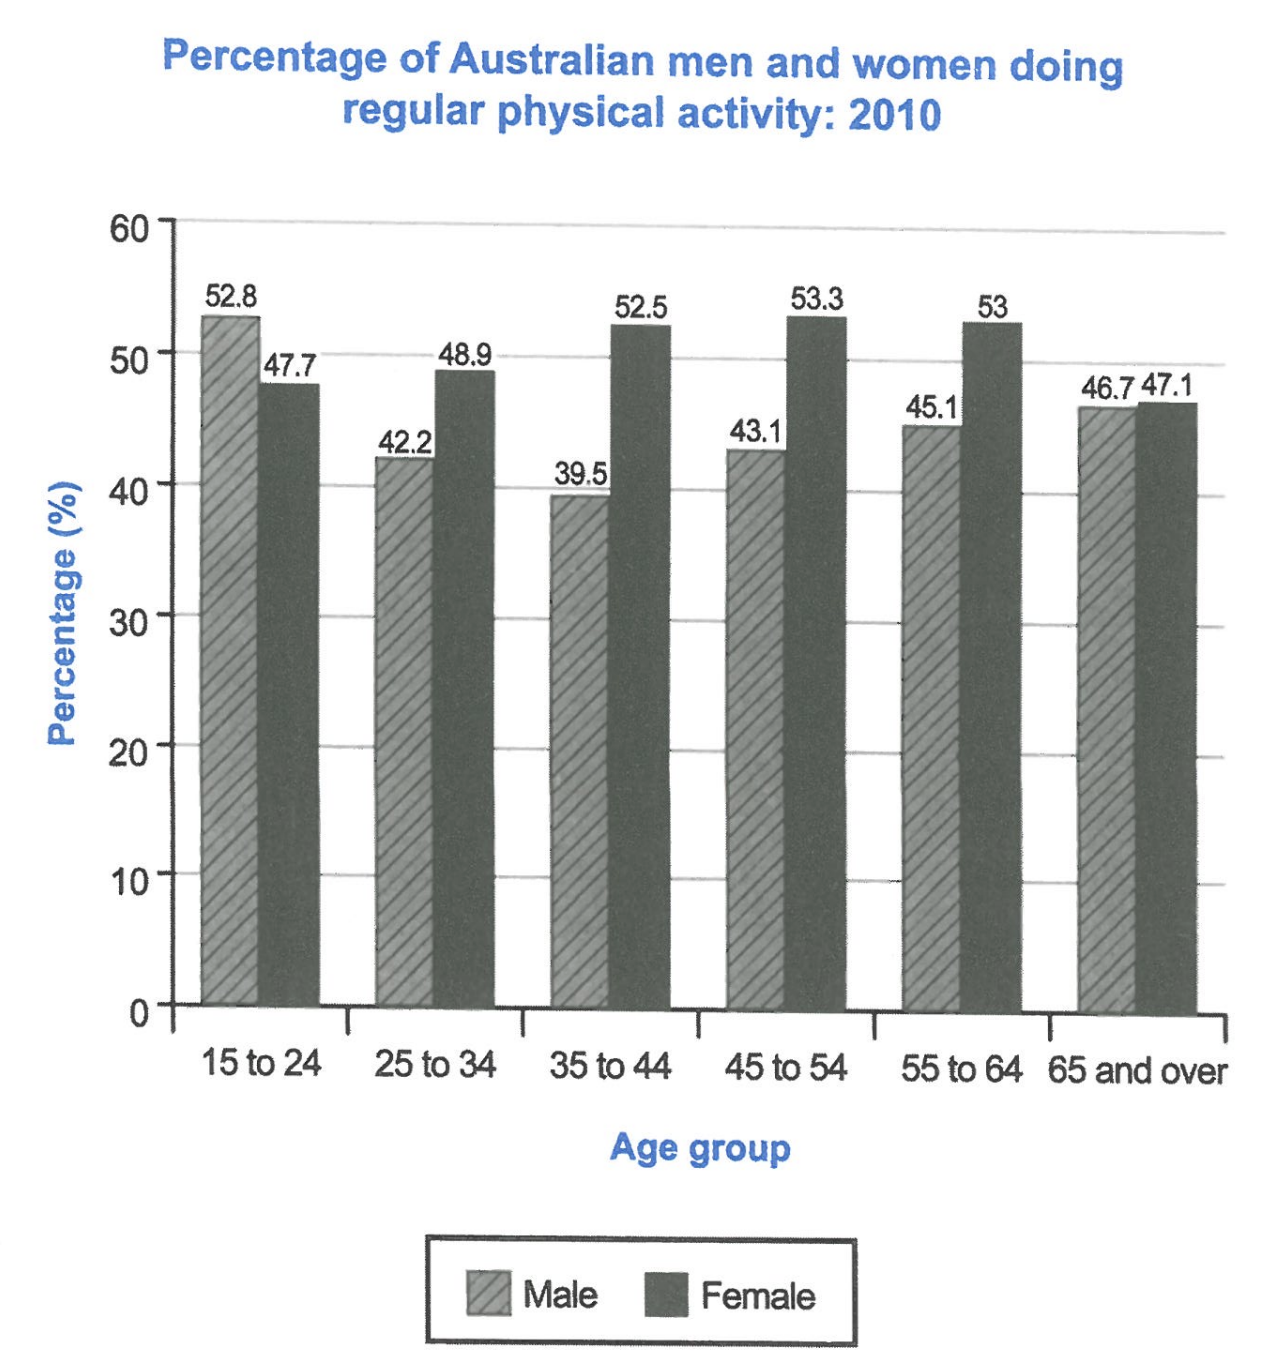
The bar chart below shows the percentage of Australian men and women in different age groups who did regular physical activity in 2010.
Summarise the information by selecting and reporting the main features, and make comparisons where relevant.
Student answer (Band 5.0)
The provided bar chart illustrates the percentage of Australian male and female in different age groups who did perform regular physical activities during 2010.
Overall, the age of 45 to 54 of wemen and the age of 15 to 25 of younger and men recorded the largest figure throughtout the period, while the age of female who 65 and above and age of men who 35 to 44 had the lowest. Another notable feature is that 65 and over ages of both men and women were equal.
By the way, 15 to 24 age of younger were 52.8% and 47.7% of women who did regular physical activities and 25 to 34 age of men were 42.2% and 48.9 of female who performed outdoor furthermore the group of men and women who were 35 to 44 age, they performed 39.5% by men and 52.5 by women. additionally, in the 45 to 54 45.1% of men and 53.3% of women performed physical games and in the age of 55 to 64, 45.1% of men and 53% of women who did outdoor activities. Finally, 65 and above ages of male and female were approximately equal percentage.
AI examiner evaluation
| Criterion | Band |
|---|---|
| Task Achievement / Task Response | 5.0 |
| Coherence and Cohesion | 5.0 |
| Lexical Resource | 5.5 |
| Grammatical Range and Accuracy | 5.0 |
| Overall | 5.0 |
Task Achievement / Task Response: Band 5.0
You identify the chart’s subject and include several relevant figures, including the male low of 39.5% for ages 35–44 and the female peak of 53.3% for ages 45–54. However, the overview contains important inaccuracies: the highest male figure is for ages 15–24, but the female peak is not the only leading feature, and the two 65-and-over figures (46.7% and 47.1%) are close rather than equal. The claim that women aged 65 and over had the lowest figure is also incorrect; their lowest rate is 47.7% among ages 15–24. Some comparisons are misreported or unclear, such as assigning 45.1% to men aged 45–54. A more accurate overview and carefully matched figures would make the response more complete.
Coherence and Cohesion: Band 5.0
The response has a basic structure, with an introduction, an overview and a final paragraph containing figures. This gives the reader some sense of the task’s stages. However, progression within the data paragraph is difficult to follow: “By the way” and “furthermore” do not clearly signal comparisons, and the long sentence beginning “15 to 24 age of younger” combines several age groups without a consistent pattern. The final paragraph also repeats the idea that the oldest groups are approximately equal rather than drawing the comparisons together. Organise the details in a consistent sequence—such as age group by age group—and use clear links such as “whereas” and “by contrast” to show how the sexes differ.
Lexical Resource: Band 5.5
You use enough topic vocabulary to communicate the general subject, including “percentage,” “age groups” and “regular physical activities.” There are also attempts to vary wording, such as “recorded the largest figure” and “notable feature.” However, several choices are inaccurate or unnatural for describing this chart: “physical games” and “outdoor activities” are not shown in the data, and “the age of female who 65 and above” is difficult to interpret. Spelling errors such as “wemen” and “throughtout” also reduce control. Prefer precise, repeated chart language over unsupported synonyms: for example, say that people “did regular physical activity” and that a group “had the highest/lowest percentage.”
Grammatical Range and Accuracy: Band 5.0
You attempt both simple and more extended sentences, and the opening sentence communicates the chart’s general topic. However, grammatical errors are frequent and sometimes make comparisons hard to understand. Examples include “Australian male and female” (number agreement), “the age of 45 to 54 of wemen” (unclear noun structure), and “the group of men and women who were 35 to 44 age, they performed” (faulty clause construction). Articles, plurals and sentence boundaries are also inconsistent, as in “15 to 24 age of younger were.” Use a reliable pattern for each comparison, such as “Among people aged 35–44, 39.5% of men and 52.5% of women were active,” and check agreement and punctuation in every sentence.
See this exact question answered at other band scores. The same prompt compared across bands.
Browse more IELTS Writing model answers or get your own writing scored by the same AI examiner.