Band 5.5 IELTS Writing Task 1 Model Answer
Overall Band Score: 5.5 · Cambridge IELTS 12 · 2026-11-21
IELTS Writing Task 1 question
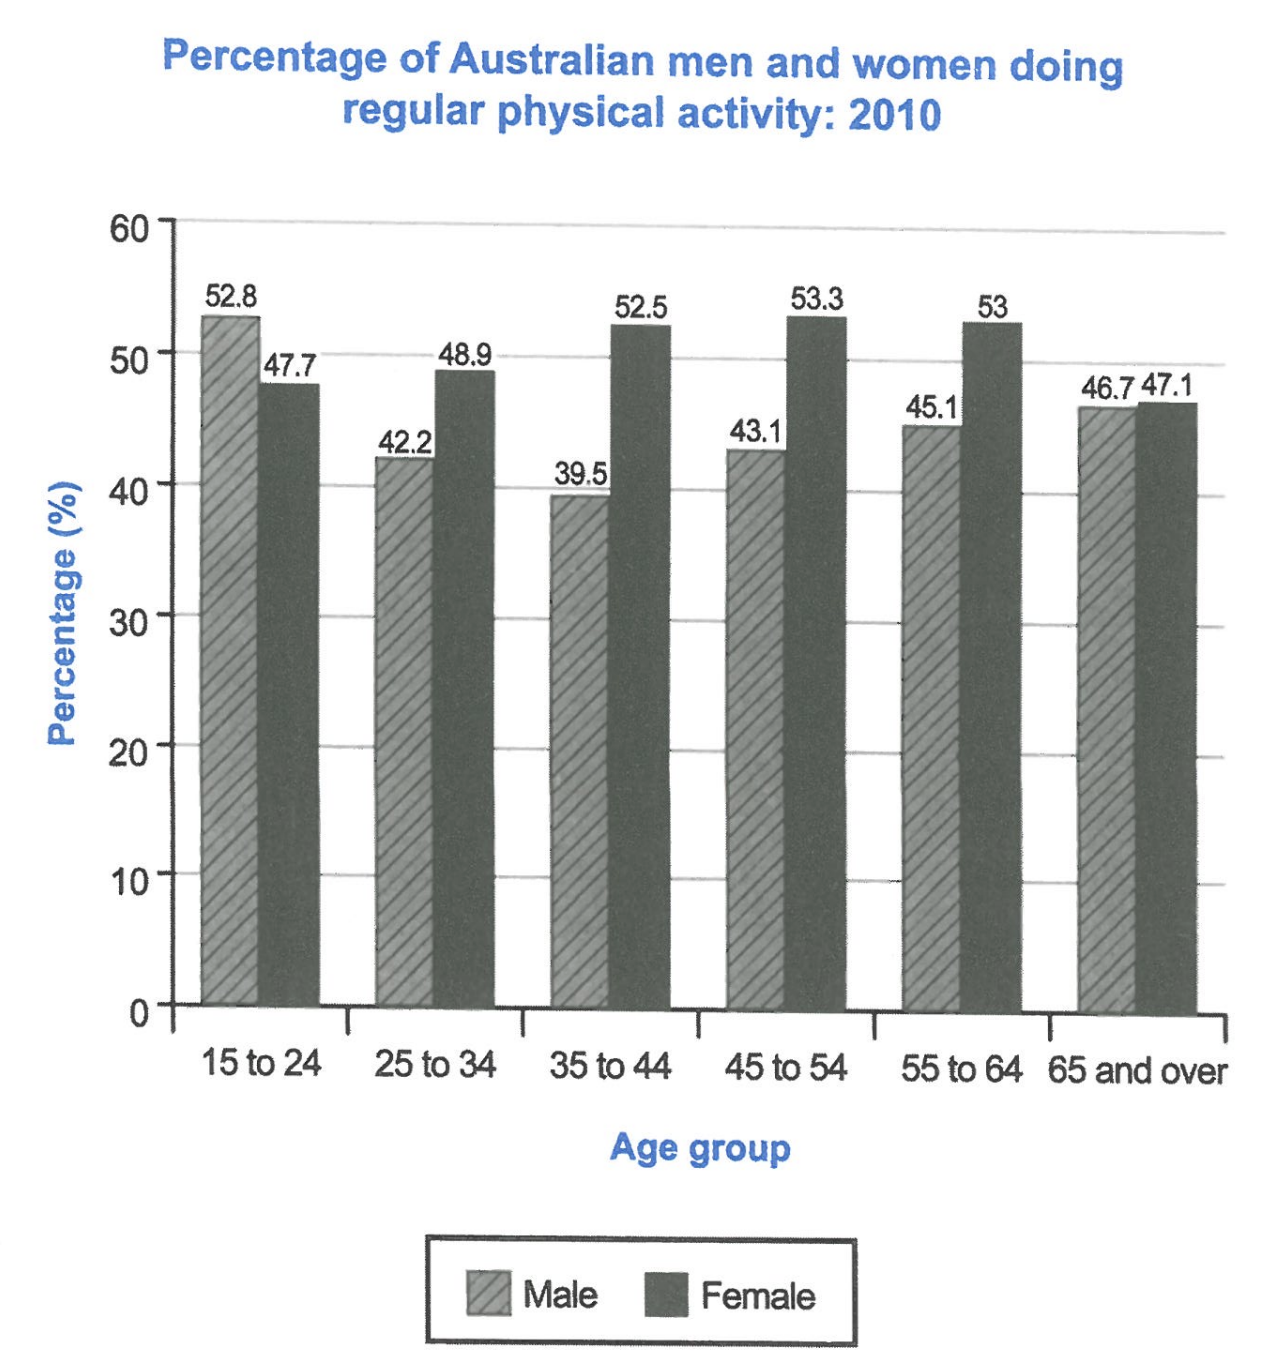
The bar chart below shows the percentage of Australian men and women in different age groups who did regular physical activity in 2010.
Summarise the information by selecting and reporting the main features, and make comparisons where relevant.
Student answer (Band 5.5)
The bar chart illustrates changes of proportions of Australian males and females in various age categories who maintained physical activity in 2010.
Overall, the bar chart demonstrates flunctuations for men and womend, furthermore females are higher in all ages than males except age from 15 to 24 years old.
In details, between age 15 to 24 the percentage of males was 52.8% higher than females which were 47.7%. In addition, between group 25 to 34 years, female were higher within 48.9% and males was 42.2%. Furthermore, middle age demonstrated lowest proportion for males with 39.5% wheras females 52.5%.
age group from 45 to 54 revelaed the highest percentage for females as 53.3% as males were lower wit 43.1%. Last but not least, the sixth category presents second highest percentage for females which located by 53% whereas males 45.1%. Ultimitaley, last group indicates approximately equall percentage as females 74.1% and males 46.7%.
AI examiner evaluation
| Criterion | Band |
|---|---|
| Task Achievement / Task Response | 5.5 |
| Coherence and Cohesion | 6.0 |
| Lexical Resource | 5.5 |
| Grammatical Range and Accuracy | 5.0 |
| Overall | 5.5 |
Task Achievement / Task Response: Band 5.5
You identify the chart’s subject and make a useful comparison in the overview: women recorded higher participation in every age group except 15–24. Several figures are also reported accurately, including 52.8% for young men and 53.3% for women aged 45–54. However, the overview is vague about the main trends, and the final figure is seriously misreported: women aged 65 and over were at 47.1%, not 74.1%, so this group was not approximately equal to men at 46.7%. The response also calls 55–64 the second-highest female figure, although 48.9% for ages 25–34 is lower. A clearer overview and more careful selection and checking of key comparisons would make the summary more complete and reliable.
Coherence and Cohesion: Band 6.0
The response has a recognisable structure, with an introduction, an overview and a sequence of age-group comparisons. Linking expressions such as “In addition” and “Furthermore” help signal the movement between details. However, the progression is somewhat mechanical, and the overview’s “In details” paragraphing does not clearly group the data into meaningful patterns. The final comparisons are also difficult to follow: “the sixth category” and “last group” are imprecise references, and the incorrect 74.1% figure undermines the comparison. Organise the body around the main contrast—men’s and women’s rates across the age groups—and use explicit age labels consistently. This would make the relationships between figures easier to follow.
Lexical Resource: Band 5.5
You use a reasonable range of chart-related vocabulary, including “proportions,” “percentage,” “age categories,” and “highest percentage,” and the meaning is generally recoverable. However, several word-choice, collocation and spelling problems reduce precision: “changes of proportions” is awkward for a single-year chart, “maintained physical activity” is not the most natural description, and “flunctuations,” “wheras,” “revelaed” and “Ultimitaley” are misspelled. “Females are higher” is also imprecise because the rates, rather than the people, are higher. Prefer concise, conventional reporting language such as “the proportion who exercised regularly” and “women’s rate exceeded men’s.” Proofreading spelling and collocations would improve clarity.
Grammatical Range and Accuracy: Band 5.0
You attempt both simple and more complex sentence forms, including comparisons with “whereas” and clauses introduced by “which.” However, control is inconsistent, and errors sometimes make relationships between figures unclear. For example, “between age 15 to 24” uses an incorrect preposition pattern, while “female were higher within 48.9% and males was 42.2%” has problems with number agreement and sentence construction. The sentence beginning “middle age demonstrated lowest proportion” also lacks a clear grammatical subject and article. Capitalisation is inconsistent, as in “age group from 45 to 54.” Practise building accurate comparison sentences with a clear subject, such as “Among people aged 25–34, the female rate was 48.9%, compared with 42.2% for males.”
See this exact question answered at other band scores. The same prompt compared across bands.
Browse more IELTS Writing model answers or get your own writing scored by the same AI examiner.