Band 6.0 IELTS Writing Task 1 Model Answer
Overall Band Score: 6.0 · Cambridge IELTS 12 · 2026-11-22
IELTS Writing Task 1 question
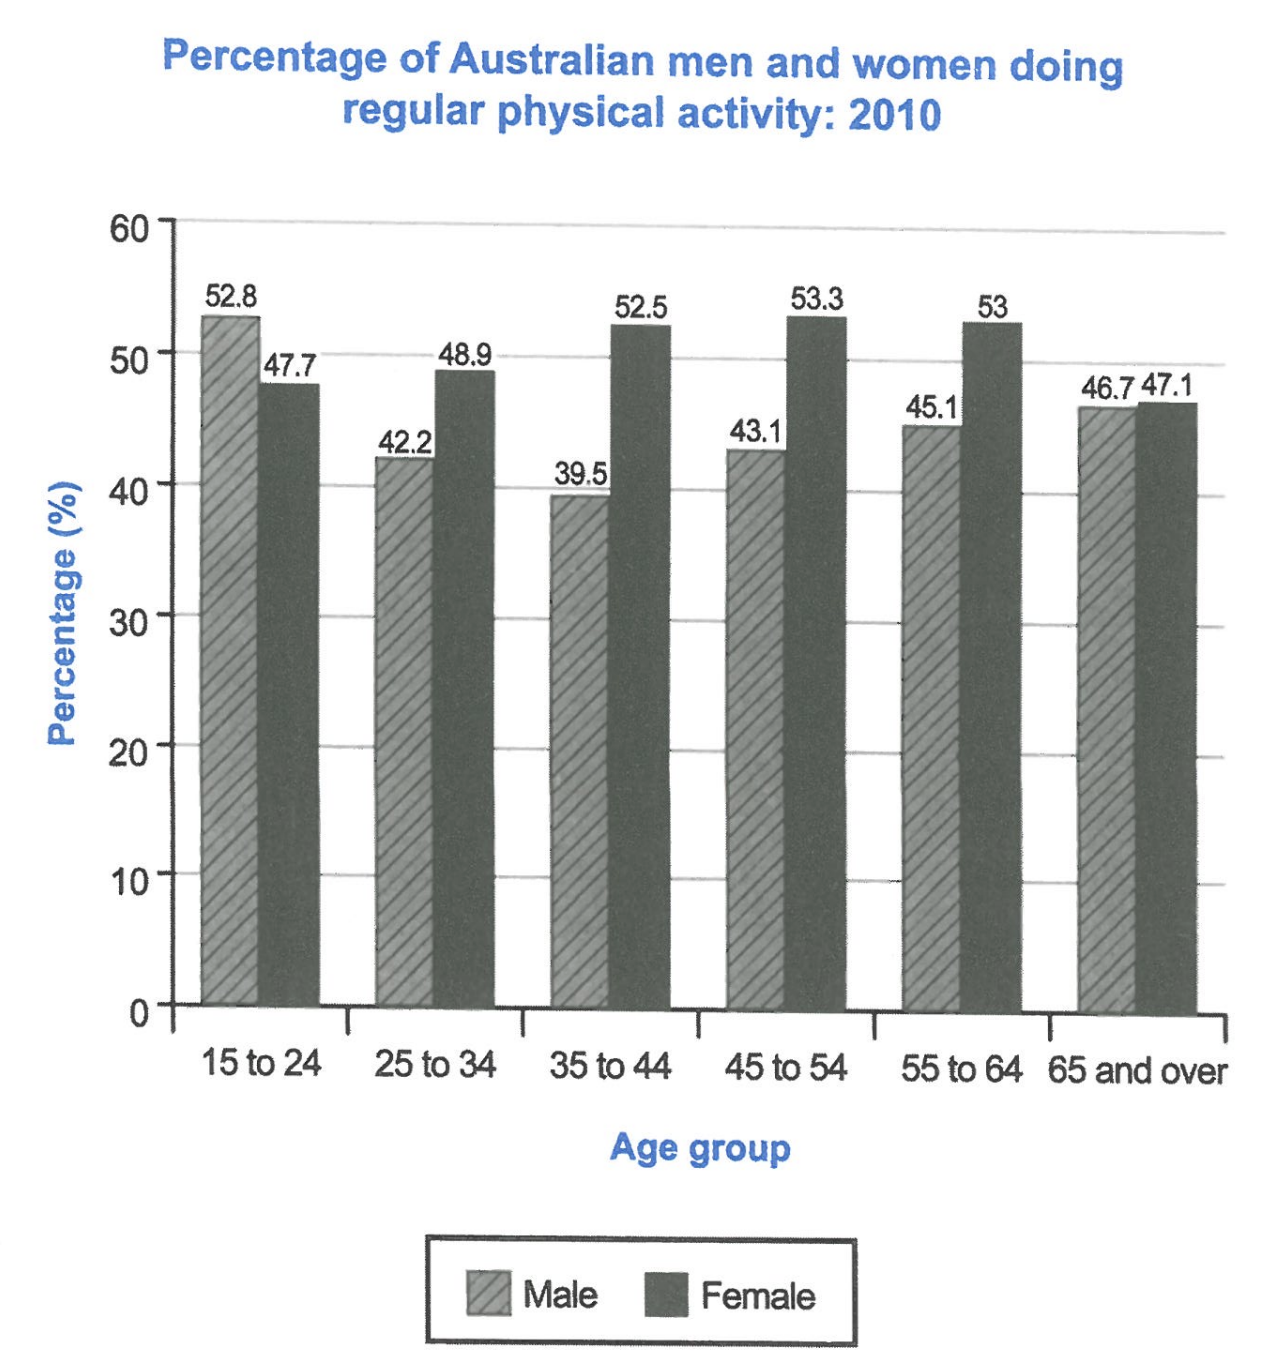
The bar chart below shows the percentage of Australian men and women in different age groups who did regular physical activity in 2010.
Summarise the information by selecting and reporting the main features, and make comparisons where relevant.
Student answer (Band 6.0)
The bar chart compares the percentage of different age groups of men and women from Australia who did regular workouts in 2010.
Overall, women from different age groups did the most workout than men, which rosed from teenagers until adults around 45. However, the workout done by men is oppositely different than women, which fell from teenagers until adults around 44.
The highest percentage of physical activity done by men was in the age of 15 to 24, which is 52.8%, being higher than women. But the percetage decresed around 13% until the age group of 35 to 44, which is exactly 39.5%. But men's percentage gained back up and the percentage increased until 65 and over, around 46.7%.
Women's workout percentage remain steady throughout the age groups, but it has rosed around 16% until the age group of 45 to 54, which is 53.3%. After it increased, the percentage fell down slightly until the yeat 65 and over, around 47.1%
AI examiner evaluation
| Criterion | Band |
|---|---|
| Task Achievement / Task Response | 6.5 |
| Coherence and Cohesion | 6.5 |
| Lexical Resource | 5.5 |
| Grammatical Range and Accuracy | 5.5 |
| Overall | 6.0 |
Task Achievement / Task Response: Band 6.5
You identify the chart’s subject and provide an overview of the contrasting trends: male participation falls from the youngest group before recovering, while female participation rises to a middle-age peak and then declines. Several figures are accurately reported, including the male high of 52.8%, the male low of 39.5%, and the female peak of 53.3%. However, the overview overgeneralises that women did more activity across age groups: men were higher among 15–24-year-olds. The claim that women’s figures “remain steady” also understates their rise from 47.7% to 53.3%. Some comparisons are not fully developed; for example, you could state clearly that women exceeded men in every group except the youngest. A more precise overview and fuller comparisons would strengthen the report.
Coherence and Cohesion: Band 6.5
The response has a clear four-paragraph structure, moving from an introduction and overview to separate descriptions of men and women. This gives the information a generally logical progression, and sequencing phrases such as “Overall,” “But,” and “After” help the reader follow changes over time. However, some links are mechanical or unclear. In the overview, “which rosed from teenagers until adults around 45” does not make clear whether “which” refers to women’s activity or age groups. Repeated use of “percentage” and “workout” also makes the account feel less smoothly connected. The male paragraph’s repeated “But” interrupts the flow. Use clearer references and vary the way you connect comparisons, such as contrasting the two sexes directly within the same age groups.
Lexical Resource: Band 5.5
You use relevant chart vocabulary, including “percentage,” “age group,” “increased,” “decreased,” and “fell,” so the main trends are usually understandable. There is also some attempt to vary wording with “gained back up.” However, the range and precision are limited, and several choices are unnatural for an academic chart report: “did the most workout,” “workout done,” and “women’s workout percentage” are not suitable collocations. Errors such as “rosed,” “percetage,” “decresed,” and “yeat” also reduce accuracy. Prefer consistent terms such as “regular physical activity” or “participation rate,” and use precise trend verbs such as “rose,” “declined,” and “recovered.” This would make the description more formal and exact.
Grammatical Range and Accuracy: Band 5.5
You attempt both simple and more complex sentences, including clauses with “which” and “until,” and the reader can generally understand the intended trends. However, errors in verb forms and sentence construction are noticeable. For example, “which rosed” and “it has rosed” use an incorrect past form, while “women … did the most workout than men” has an inaccurate comparative structure. In “the percentage fell down slightly until the yeat 65 and over,” the time expression does not fit the chart’s age-group category. Some long sentences also join several ideas with repeated “which” clauses, making relationships less clear. Practise accurate past-tense forms and build comparisons with patterns such as “women’s rate was higher than men’s in…” while retaining a mix of sentence structures.
See this exact question answered at other band scores. The same prompt compared across bands.
Browse more IELTS Writing model answers or get your own writing scored by the same AI examiner.