Band 5.5 IELTS Writing Task 1 Model Answer
Overall Band Score: 5.5 · Cambridge IELTS 12 · 2026-11-05
IELTS Writing Task 1 question
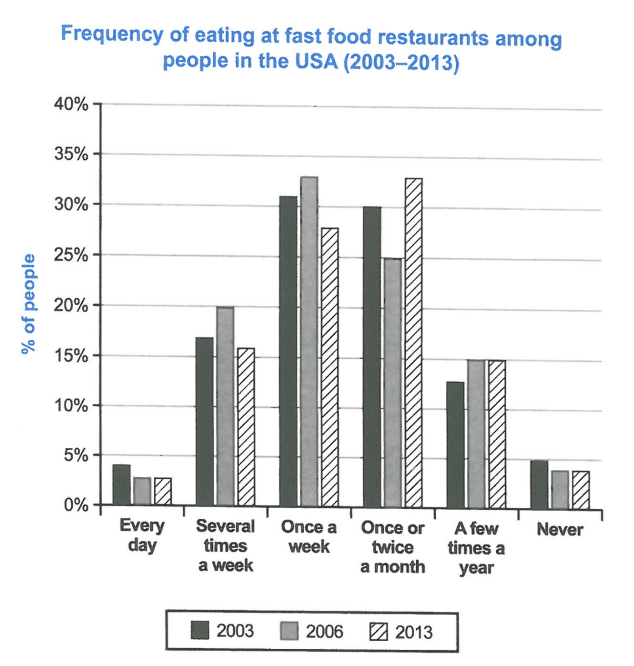
The chart below shows how frequently people in the USA ate in fast food restaurants between 2003 and 2013.
Summarise the information by selecting and reporting the main features, and make comparisons where relevant.
Student answer (Band 5.5)
The bar graph illustrates the preferance of people eating fast foods in USA from the year (2003 to 2013).There are three main bars representing three different years, black represents year 2003, grey represents year 2006 while white with black slanted lines represents year 2013.
Overall, it can be seen that once a week have been chosen by people mostly in all the years, while never remained the least preferable option followed by every day as well.Once a month also remained highest option among all the years while several times a year and week are almost same to each other.
In year 2003 , people had mostly prefer to eat in restaurants once a week having 33% of the comsumers,while once a month is at 25%.However, people prefering to eat few times a year or several times a week are 15% and 20% respectively.Moreover, people eating every day in restaurants or never are almost almost same at 4% to 3%.
In year 2006 and year 2013 people are prefering mostly the once or twice a month in restaurant or once a week equally. A few times a year is same in both the years at 15% respectively. While everyday and never are also same at 3% and 4% respectively.
AI examiner evaluation
| Criterion | Band |
|---|---|
| Task Achievement / Task Response | 5.5 |
| Coherence and Cohesion | 6.0 |
| Lexical Resource | 5.5 |
| Grammatical Range and Accuracy | 5.5 |
| Overall | 5.5 |
Task Achievement / Task Response: Band 5.5
You identify the main categories and attempt an overview, but several key comparisons are inaccurate or unclear, which limits how fully the chart is reported. In 2003, the highest figure was once a week at 31%, not 33%; 33% belongs to 2006. The claim that once a week was the most popular in every year is also incorrect: in 2013, once or twice a month was highest at 33%. Your overview additionally says “once a month” was highest across all years, contradicting the earlier claim and the data. The final paragraph groups 2006 and 2013 together without clearly distinguishing their different peaks. Select the main trends accurately, then support them with year-specific comparisons.
Coherence and Cohesion: Band 6.0
The response has a recognisable structure: an introduction, an overview and two detail paragraphs. This gives the reader a basic route through the information, and phrases such as “Overall” and “Moreover” help signal relationships. However, progression is weakened by contradictory overview statements and by grouping 2006 and 2013 together even though their leading categories differ. Some linking is mechanical or awkward, particularly the repeated use of “while” and “Moreover,” and the final paragraph’s “While everyday and never…” is left as a fragment. Improve cohesion by organising details by year or by comparing the same categories across years, and use clear references so each comparison is easy to follow.
Lexical Resource: Band 5.5
You use enough chart-related vocabulary to communicate the topic, including “bar graph,” “represents,” “consumers,” and frequency expressions such as “once a week.” However, word choice and collocation are often inaccurate or repetitive: “the preferance of people eating fast foods” and “once a month remained highest option” do not express the data naturally. There are also spelling errors, including “preferance” and “comsumers,” and “several times a year” is used where the chart says “a few times a year.” Aim for precise, consistent labels from the chart and use natural reporting phrases. This would make the description clearer and more appropriate for an academic summary.
Grammatical Range and Accuracy: Band 5.5
You attempt both simple and more complex sentences, including clauses introduced by “while” and “however,” but control is uneven. Agreement and verb forms are problematic in “once a week have been chosen” and “people had mostly prefer,” while “people are prefering” uses an incorrect progressive form. Articles and sentence boundaries also need attention: “in USA” should be “in the USA,” and there is no space after the full stop in “2013).There.” The final sentence beginning “While everyday and never…” is incomplete. These errors sometimes make comparisons harder to interpret. Practise accurate past-tense reporting and complete sentence structures, while retaining the range of sentence forms you are attempting.
See this exact question answered at other band scores. The same prompt compared across bands.
Browse more IELTS Writing model answers or get your own writing scored by the same AI examiner.