Band 5.5 IELTS Writing Task 1 Model Answer
Overall Band Score: 5.5 · Cambridge IELTS 12 · 2026-11-05
IELTS Writing Task 1 question
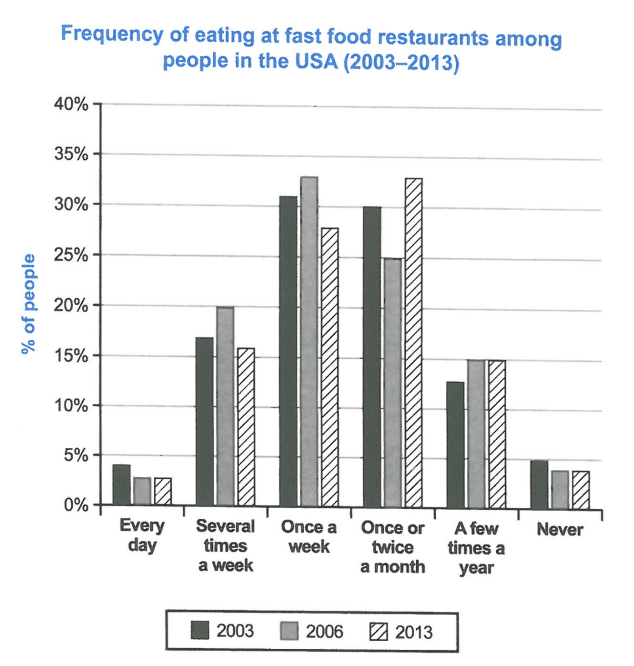
The chart below shows how frequently people in the USA ate in fast food restaurants between 2003 and 2013.
Summarise the information by selecting and reporting the main features, and make comparisons where relevant.
Student answer (Band 5.5)
The bar chart compares six types of fast food addicts who eat fast food and their percentage in three different years 2003, 2006, and 2013.
Overall, the people who ate once a week or twice a month are always on top with little bot difference in all years. While, on the balanced side every day users and people who never try faty food and on the lowest side in all years.
At the bigning, every day onsumers of fast food are 4% in 200 but 3% in other years also people who never taste fast food are 5% in 2003 and 4% other years. Further more, there is 20% ratio in 2006 of people who consume fast food various time a week but there value approxemately 12% in 2003 and 2013. Moreover, weekely eaters are at the top in all years 2003,2006, and 2013 (about 31, 33, and 28%). in addition peole who eat fatty ood twice a month are 30%,25% and 33% in 2003, 2006, and 2013. At the end, yearly eaters are equal in 2006 and 2013 about 15% and 13% in 2003.
AI examiner evaluation
| Criterion | Band |
|---|---|
| Task Achievement / Task Response | 6.0 |
| Coherence and Cohesion | 6.0 |
| Lexical Resource | 5.0 |
| Grammatical Range and Accuracy | 5.0 |
| Overall | 5.5 |
Task Achievement / Task Response: Band 6.0
You identify the main categories and report several relevant figures, including the weekly-eating percentages (31%, 33% and 28%) and the monthly figures (30%, 25% and 33%). Your overview also recognises that daily eating and never eating were the least common patterns. However, some details are inaccurate: the “a few times a year” figures were 12.5%, 15% and 15%, not approximately 12%, 13% and 15%; and the 2003 “never” figure was 4.5%, rather than 5% (a small approximation). The overview’s claim that weekly and monthly eaters were “always on top” is unclear, since the monthly category was highest in 2013. Some categories are also described imprecisely. Select the key comparisons more clearly and ensure each figure is matched to its correct frequency group and year.
Coherence and Cohesion: Band 6.0
The response has a recognisable structure: an introduction, an overview and a paragraph of supporting figures. It also moves broadly from the least common patterns to the more frequent categories, and linking phrases such as “Further more” and “Moreover” signal additions. However, the progression is sometimes difficult to follow because several categories are packed into one paragraph and the comparisons are not grouped consistently. Phrases such as “on the balanced side” and “At the end” do not clearly show how the information relates. The overview sentence beginning “While” is also incomplete, which weakens the connection between its ideas. Organise the details into clearer comparisons—for example, frequent eating patterns versus occasional or rare eating—and use linking expressions that accurately describe the relationship between figures.
Lexical Resource: Band 5.0
You use some task-relevant vocabulary, including “percentage,” “consume,” “weekly eaters” and “twice a month,” so the reader can generally identify the categories being discussed. However, word choice and spelling errors are noticeable and sometimes make the meaning less clear. “Fast food addicts” is an unsuitable label for people represented by the chart, while “fatty food” changes the meaning from fast food. There are also misspellings such as “bigning,” “onsumers,” “approxemately” and “peole.” Some expressions, including “on the balanced side” and “yearly eaters,” are not natural or precise in this context. Use the chart’s category labels consistently and check spelling carefully; this will make your descriptions more accurate and easier to understand.
Grammatical Range and Accuracy: Band 5.0
You attempt both simple and more complex sentence forms, including a contrast with “While” and sentences that report several years’ figures. However, some sentence structures are incomplete or awkward. The overview begins “While, the balanced side…” without a complete main clause, and “every day users and people who never try … and on the lowest side” does not form a clear grammatical sentence. There are also errors in articles, agreement and sentence boundaries, as in “there is 20% ratio” and the lowercase “in addition” after a full stop. These issues sometimes make relationships between ideas difficult to follow. Build complete clauses, use consistent past-tense reporting for the historical data, and check punctuation and agreement when combining comparisons.
See this exact question answered at other band scores. The same prompt compared across bands.
Browse more IELTS Writing model answers or get your own writing scored by the same AI examiner.