Band 5.0 IELTS Writing Task 1 Model Answer
Overall Band Score: 5.0 · Cambridge IELTS 12 · 2026-11-06
IELTS Writing Task 1 question
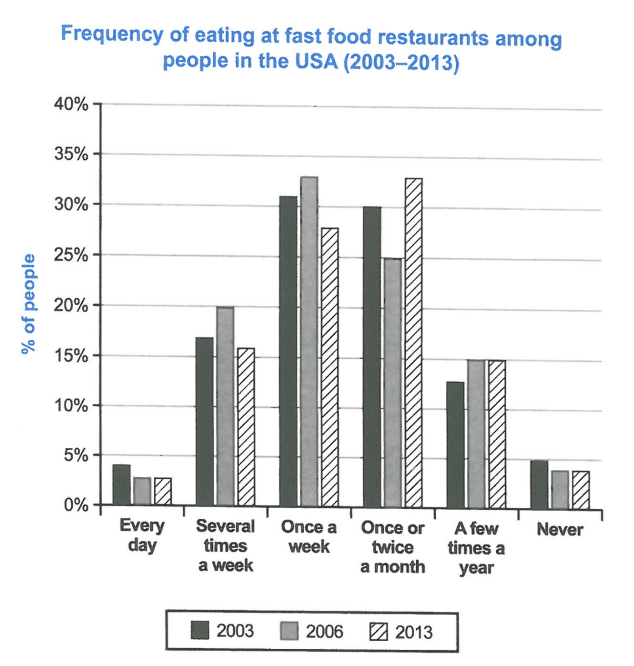
The chart below shows how frequently people in the USA ate in fast food restaurants between 2003 and 2013.
Summarise the information by selecting and reporting the main features, and make comparisons where relevant.
Student answer (Band 5.0)
The given bar graph represents the data of USA citizens for eating in fast food restaurants between the year 2003, 2006 and 2013. 2006 and 2013 year is at peak of eating fast food once a week and once or twice a month, however, 2006 and 2013 shows all time low interest for every day and never eating in restaurants.
The once a week interested people makes around 30 percent in 2003 followed more than 30 in 2006 and 27 in 2013. Moreover, never and everyday category is lowest among all the group 2006 and 2013 is almost 6 to 7 percent, whereas,
2003 is 5 for never eatind and 8 for everyday eating in restaurants. A few times a year in 2013 and 2006 is same 15 percent but 2003 is 17.
From all the categories once a week and once or twice a month individuals eating fast food in the year 2006 and 2013 is highest.
AI examiner evaluation
| Criterion | Band |
|---|---|
| Task Achievement / Task Response | 5.5 |
| Coherence and Cohesion | 4.5 |
| Lexical Resource | 5.0 |
| Grammatical Range and Accuracy | 5.0 |
| Overall | 5.0 |
Task Achievement / Task Response: Band 5.5
You identify the chart’s subject and mention several relevant categories, including weekly visits, monthly visits, and the low-frequency groups. However, the overview is unclear and includes inaccurate claims: 2006 was not the peak for eating once a week (that was 33% in 2006, slightly above 31% in 2003, while 2013 was 28%), and the daily and never figures were not collectively at an all-time low in both 2006 and 2013. Several figures are substantially misreported: for example, in 2003, daily eating was about 4%, not 8%, and eating a few times a year was about 12.5%, not 17%. To strengthen the response, give a clear overview of the main shifts—monthly eating peaked in 2013, while weekly eating declined after 2006—and compare the figures accurately.
Coherence and Cohesion: Band 4.5
The response has some organisation: it begins by introducing the chart, then discusses selected categories, and ends with a general comparison. However, the progression is difficult to follow because the overview and supporting details are mixed together, and the final sentence repeats an earlier point without clarifying it. Linking words such as “however” and “Moreover” are used, but the relationships they signal are sometimes unclear; for instance, “however” introduces a claim about low interest that does not clearly contrast with the preceding statement. The sentence beginning “Moreover, never and everyday category…” also combines several comparisons without a clear structure. Use a distinct overview paragraph followed by paragraphs grouping the main trends, and connect each comparison explicitly to its year and category.
Lexical Resource: Band 5.0
You use some relevant chart vocabulary, including “bar graph,” “percent,” “category,” and “peak,” so the topic is generally recognisable. However, the range is limited and several phrases are unnatural or imprecise, such as “data of USA citizens for eating,” “once a week interested people,” and “all time low interest.” These choices make some comparisons harder to understand. There are also spelling and word-form problems, including “eatind,” and “everyday” is used where “every day” is needed to mean daily. Aim for precise reporting language such as “the proportion of people who ate out,” “the figure for weekly visits,” and “reached a peak.” Check spelling and distinguish category labels carefully.
Grammatical Range and Accuracy: Band 5.0
The response attempts both simple and more extended sentences, but control is uneven, and errors frequently affect clarity. For example, “2006 and 2013 year is at peak” has problems with number agreement and sentence structure, while “2006 and 2013 shows” uses a singular verb with a plural subject. The sentence “The once a week interested people makes around 30 percent in 2003 followed more than 30 in 2006 and 27 in 2013” is difficult to parse because its subject, verb forms, and comparison are not well formed. Articles and plurals are also inconsistent, as in “among all the group.” Practise building clear comparison sentences with a subject and verb for each year, and use past-tense reporting consistently, for example, “The figure rose to 33% in 2006, then fell to 28% in 2013.”
See this exact question answered at other band scores. The same prompt compared across bands.
Browse more IELTS Writing model answers or get your own writing scored by the same AI examiner.