Band 4.5 IELTS Writing Task 1 Model Answer
Overall Band Score: 4.5 · Cambridge IELTS 12 · 2026-11-06
IELTS Writing Task 1 question
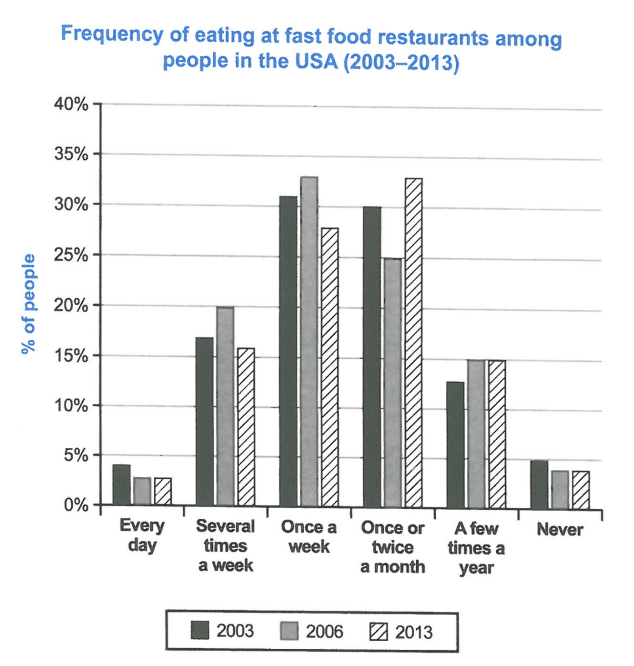
The chart below shows how frequently people in the USA ate in fast food restaurants between 2003 and 2013.
Summarise the information by selecting and reporting the main features, and make comparisons where relevant.
Student answer (Band 4.5)
The bar chart demonstrate how frequently people in the USA ate in fast food restaurants since 2003 and 2013. In 2003 every day people in the usa ate 4% 2006 and 2013 are same 3%. Several times a week 2003 people ate restaurant 16% but 2006 people ate 20% however 2013 people are increase that is 15%. Once a week in 2003 people big increase that is almost 31% and also 2006 people in USA 33% that is big change but 2013 people are 27%. Once or twice a month people ate in USA decreased 30% and also 2006 people 25% but in that 2013 people was most increased that is 33%. A few times a year in 2003 that was big down fall that was only 13% and also down fall 2006 and 2013 that was 15%. Never people in USA 2003 was 5% but the 2006 and 2013 awas only 4% that is much less.
So this bar chart I describe whole thing.
AI examiner evaluation
| Criterion | Band |
|---|---|
| Task Achievement / Task Response | 4.5 |
| Coherence and Cohesion | 4.5 |
| Lexical Resource | 5.0 |
| Grammatical Range and Accuracy | 4.5 |
| Overall | 4.5 |
Task Achievement / Task Response: Band 4.5
You identify all six eating-frequency categories and include figures for each year, so the response contains relevant chart information. However, the task is addressed only minimally: there is no clear overview of the main pattern, and the figures are mostly listed category by category without selecting the most important comparisons. Some details are inaccurate: for example, “several times a week” in 2013 was about 16%, not 15%, and “once a week” was about 28%, rather than 27%. The description of “a few times a year” as a “big down fall” is also misleading, since it rose from about 12.5% to 15%. Add an overview noting that monthly eating became the most common frequency by 2013, while daily eating and never eating remained uncommon.
Coherence and Cohesion: Band 4.5
The response follows the chart’s categories in a recognisable order, which gives the reader some sense of how the information is organised. However, it is presented as one long paragraph, with no clear separation between an introduction, an overview and supporting details. Connections between ideas are often mechanical or unclear: repeated use of “and also” and “but” does not consistently show whether figures are being compared or whether a trend is changing. Phrases such as “2003 people ate restaurant 16%” also make the relationship between the year, category and figure difficult to follow. Group the information into paragraphs and use clear comparisons, such as contrasting weekly and monthly visits across the three years.
Lexical Resource: Band 5.0
You use basic vocabulary relevant to the chart, including “every day,” “once a week” and “never,” and the reader can generally identify the categories being discussed. However, the range is limited and several expressions are repetitive or imprecise, such as “big increase,” “big change” and “big down fall.” Some word combinations are unnatural, including “people ate restaurant” and “most increased,” which can make the intended meaning less clear. Use precise language for describing proportions and trends, for example, “accounted for,” “rose,” “fell” and “remained stable.” Also take care with spelling and word forms, as in “down fall” and “awas”; accurate, natural phrasing will make the report easier to understand.
Grammatical Range and Accuracy: Band 4.5
The response attempts to report several comparisons, but it relies mainly on short, loosely connected sentence patterns, and grammatical errors are frequent enough to affect clarity. For example, “The bar chart demonstrate” has incorrect subject–verb agreement, while “In 2003 every day people in the usa ate 4%” lacks a clear grammatical structure for reporting the figure. Tense and agreement are also inconsistent in phrases such as “2013 people are increase” and “people was most increased.” Punctuation is limited, so several ideas run together. Practise a reliable pattern such as “In 2003, 31% of people ate fast food once a week,” then vary it with accurate comparative sentences using “rose,” “fell” or “remained.”
See this exact question answered at other band scores. The same prompt compared across bands.
Browse more IELTS Writing model answers or get your own writing scored by the same AI examiner.