Band 5.5 IELTS Writing Task 1 Model Answer
Overall Band Score: 5.5 · Cambridge IELTS 12 · 2026-11-07
IELTS Writing Task 1 question
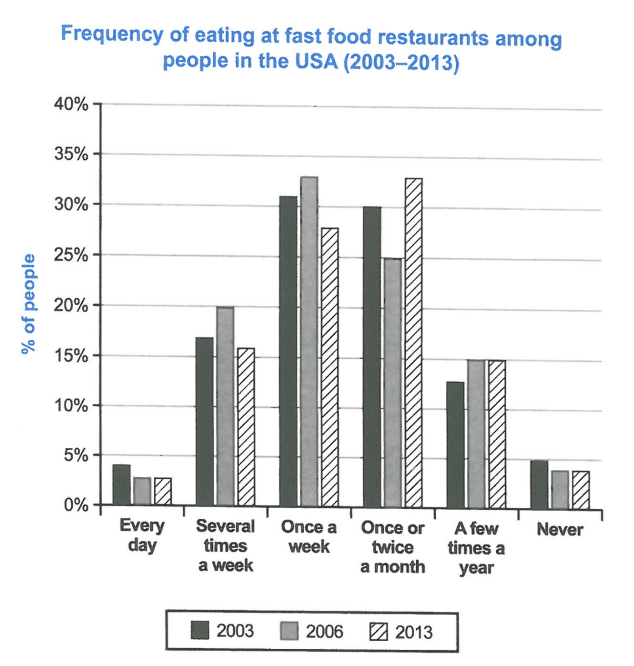
The chart below shows how frequently people in the USA ate in fast food restaurants between 2003 and 2013.
Summarise the information by selecting and reporting the main features, and make comparisons where relevant.
Student answer (Band 5.5)
The bar graph illustrates the information of people that how often they ate junk food of restaurants during the year 2003 and 2013
Overall, the rate of eating fast food in once a week and once or twice a month is higher in all three perionds, while the percentage of eating never junk food or every day is very less in all three period.
In details, the proportion of once a week and once or twice a month is around 30 percentage in 2003 , 2006 and 2013, both categories were nearly the same . The second highest proportion is of individuals who ate several times a week or few times in year, which nearlly the same , around 15 percentage.
The least percentage is of people who ate every day which is below the 5 percent in 2003, 2006 and 2013. The 2ndl least in individuals who never eat in restaurant. which is also near tp 5 percent in all periods
AI examiner evaluation
| Criterion | Band |
|---|---|
| Task Achievement / Task Response | 5.5 |
| Coherence and Cohesion | 5.5 |
| Lexical Resource | 5.0 |
| Grammatical Range and Accuracy | 5.0 |
| Overall | 5.5 |
Task Achievement / Task Response: Band 5.5
You identify the broad pattern that weekly and monthly visits were the most common, while daily visits and never eating out were least common. However, the overview is too general to capture the main changes across the three years. For example, weekly visits peaked at 33% in 2006 before falling to 28% in 2013, while monthly visits rose from 25% in 2006 to 33% in 2013. The claim that both main categories were “around 30 percentage” in every year obscures these differences. Some details are also inaccurate: “several times a week” was 20% in 2006, not around 15%, and “a few times a year” was 12.5% in 2003. Select and compare the key figures more precisely to make the summary more complete.
Coherence and Cohesion: Band 5.5
The response has a basic paragraph structure, moving from an introduction to an overview and then to details about common and uncommon frequencies. This gives the reader a general route through the information. However, progression within the detail paragraphs is limited: the second paragraph groups two categories together without clearly comparing their changes, and the final paragraph repeats the idea that the lowest figures were below or near 5%. Linking and reference are sometimes unclear, as in “both categories were nearly the same,” which does not specify whether this applies to all years or to the two categories. Organise the body around clear comparisons—for example, changes in weekly versus monthly eating, followed by the less frequent categories—and use precise references to each year.
Lexical Resource: Band 5.0
You use some relevant chart vocabulary, including “proportion,” “percentage,” “rate,” and “second highest,” so the topic is generally understandable. However, the range is limited and several choices are inaccurate or unnatural. “Junk food of restaurants” does not describe the chart’s measure as clearly as “fast food at restaurants,” while “the information of people that how often” is an awkward way to introduce frequency. Repetition of “percentage” and “proportion” also makes the description less precise, and spelling errors such as “perionds,” “nearlly,” and “tp” are noticeable. Build a more accurate set of expressions for reporting data, such as “the share of people who ate out weekly,” and check spelling and collocations before finishing.
Grammatical Range and Accuracy: Band 5.0
The response communicates its general meaning through mostly simple statements, but the range of sentence structures is limited and errors occur frequently. The opening, “illustrates the information of people that how often they ate,” has an incorrect clause structure; a clearer form would be “shows how often people ate at fast-food restaurants.” There are also problems with articles, agreement, and sentence boundaries, as in “the proportion of once a week and once or twice a month is” and “The 2ndl least in individuals who never eat in restaurant.” Tense shifts from past reporting to present forms such as “never eat” are also inconsistent. Practise accurate comparative sentences and use past tense consistently when describing the chart’s years.
See this exact question answered at other band scores. The same prompt compared across bands.
Browse more IELTS Writing model answers or get your own writing scored by the same AI examiner.