Band 5.0 IELTS Writing Task 1 Model Answer
Overall Band Score: 5.0 · Cambridge IELTS 12 · 2026-11-07
IELTS Writing Task 1 question
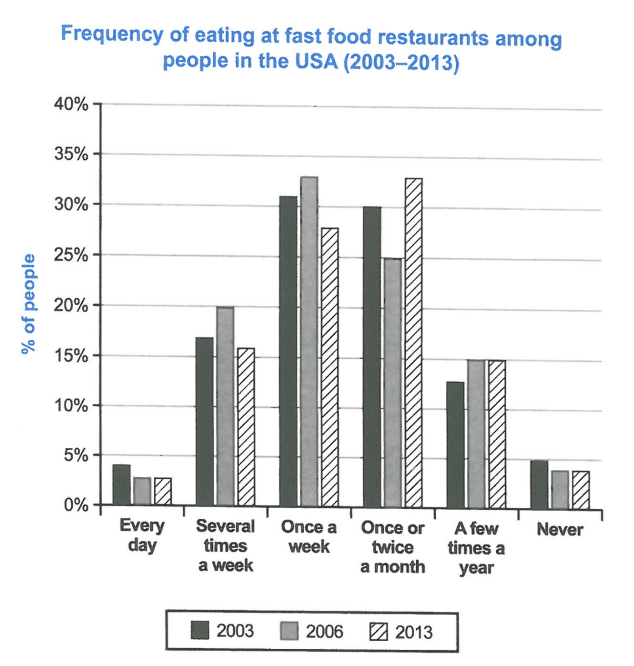
The chart below shows how frequently people in the USA ate in fast food restaurants between 2003 and 2013.
Summarise the information by selecting and reporting the main features, and make comparisons where relevant.
Student answer (Band 5.0)
The bar chart illustrate the frequency of eating at fast food restuarants in the USA in the year between 2003 and 2013. The unit is measured in percentage.
Overall, the people in the USA has the habit of eating more fast food once a week and also once or twice a month in the year 2006 and 2013 and least on eating fast food every day.
In the year 2003, people eat once a week which is the highest, comprising of 31% and eating once or twice a month, comprising of 30% respectively. People who eat several times a week and a few times a year decreased, representing 17% and 13%, whereas people who never eat and eating everyday, contributing 5% and 4% respectively.
In the year 2006 and 2013, people whoeat once a week and once or twice a week maintain the same level, representing 33% each respectively, where people who eat
AI examiner evaluation
| Criterion | Band |
|---|---|
| Task Achievement / Task Response | 4.5 |
| Coherence and Cohesion | 5.0 |
| Lexical Resource | 5.5 |
| Grammatical Range and Accuracy | 5.0 |
| Overall | 5.0 |
Task Achievement / Task Response: Band 4.5
You identify the chart’s subject and report several relevant figures, including the 2003 peaks for weekly and monthly eating and the low daily figures. However, the response only partially summarises the main features: the overview is unclear and does not accurately describe the overall pattern, and the final comparison is unfinished. There is also a significant data error: you say that in 2006 and 2013 both weekly and monthly eating were 33%, whereas 33% applies to weekly eating in 2006 and monthly eating in 2013; the other category values differ. The chart’s main shift from weekly eating being most common in 2003/2006 to monthly eating in 2013 is not clearly explained. Select the key trends and compare all three years accurately.
Coherence and Cohesion: Band 5.0
The response has a recognisable paragraph structure, moving from an introduction to an overview and then year-specific details. This gives the reader some organisation, and phrases such as “In the year 2003” help signal a change in focus. However, progression is limited: the overview is vague, the account of 2006 and 2013 begins but stops mid-sentence, and the comparisons are not developed into a complete summary. Linking words such as “whereas” are used, but the relationships between figures are sometimes unclear. For example, the sentence grouping several-times-a-week and yearly eating with “decreased” does not specify a clear comparison across years. Use a consistent structure—overview, then grouped comparisons—and complete each comparison so the reader can follow the trends.
Lexical Resource: Band 5.5
You use enough topic vocabulary to communicate the subject, including “frequency,” “comprising,” “representing,” and “percentage.” These choices show some attempt to vary the language beyond basic repetition. However, several expressions are inaccurate or unnatural, such as “the habit of eating more fast food,” “least on eating fast food,” and “maintain the same level.” The spelling error “restuarants” and the joined form “whoeat” also reduce accuracy. Some wording is repetitive, particularly repeated forms of “people who eat.” Use precise chart language such as “the proportion of people,” “accounted for,” “rose/fell,” and “was the most common frequency.” Check spelling and choose collocations that describe proportions and changes naturally.
Grammatical Range and Accuracy: Band 5.0
You attempt both simple statements and longer comparative sentences, for example the sentence beginning “In the year 2003” and the clause joined with “whereas.” This shows some structural variety, but control is inconsistent and errors occur frequently enough to make parts of the response difficult to follow. Examples include subject–verb disagreement in “the people in the USA has,” tense inconsistency in “people eat” when describing 2003, and the incomplete final sentence ending “where people who eat.” The overview also contains awkward sentence construction, while the long 2003 sentence combines several figures without clear grammatical relationships. Practise accurate past-tense reporting and agreement, and use shorter, complete sentences when comparing categories.
See this exact question answered at other band scores. The same prompt compared across bands.
Browse more IELTS Writing model answers or get your own writing scored by the same AI examiner.