Band 6.0 IELTS Writing Task 1 Model Answer
Overall Band Score: 6.0 · Cambridge IELTS 12 · 2026-11-08
IELTS Writing Task 1 question
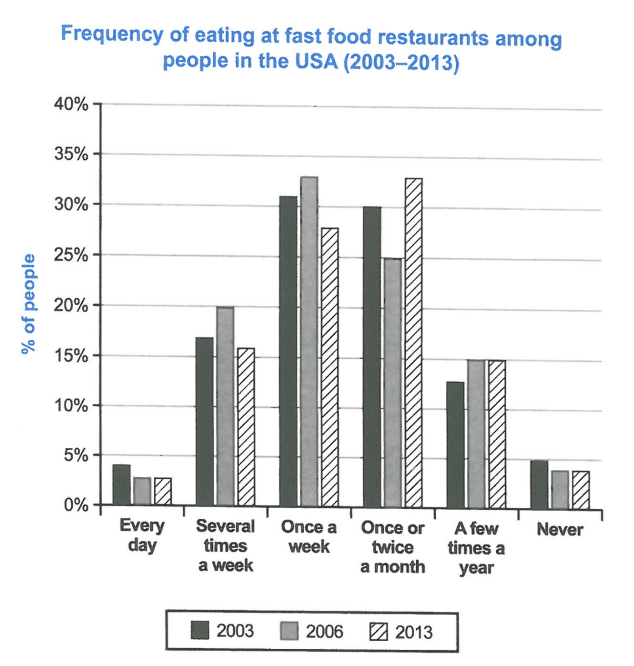
The chart below shows how frequently people in the USA ate in fast food restaurants between 2003 and 2013.
Summarise the information by selecting and reporting the main features, and make comparisons where relevant.
Student answer (Band 6.0)
The bar chart illustrates how many times Americans chose to eat in a fast food establishment over the period between 2003 and 2013. The years compared on the chart are 2003, 2006 and 2013 respectively.
Overall, it has been observed that a substantial amount of USA citizens went to the fast food restaurants at least once a week. Once or twice a month also shows approximately similar trend over the year. However, there's a significant number of people who chose to go several times a week, almost same as of those who ate fast food only few times in a year.
The year 2006 and 2013 have same proportion of people around 33% whose choice of food was "Fast Food" at least once a week or in a month. 2006 also showed 20% of the US inhabitants went fast food chains several times a week, relitavely more than in other years of comparison. Every day eaters are relatively lowest among all the categories with percentages around 4%, 2.5% and 2.5% in 2003,2006 and 2013 respectively.
AI examiner evaluation
| Criterion | Band |
|---|---|
| Task Achievement / Task Response | 6.0 |
| Coherence and Cohesion | 6.5 |
| Lexical Resource | 6.0 |
| Grammatical Range and Accuracy | 6.0 |
| Overall | 6.0 |
Task Achievement / Task Response: Band 6.0
You identify the chart’s subject and compare all three years, and you include relevant figures such as 20% eating several times a week in 2006. However, the overview is not consistently accurate or clear. The claim that monthly eating shows a similar trend “over the year” is vague, and the statement that 2006 and 2013 had the same proportion eating at least weekly or monthly does not match the chart: the categories differ, and 2013’s largest group ate once or twice a month. The daily figures are also misreported for 2006 and 2013. Select the main patterns more carefully—especially the shift from weekly eating being highest in 2006 to monthly eating being highest in 2013—and support them with accurate comparisons.
Coherence and Cohesion: Band 6.5
The response has a recognisable structure: an introduction, an overview, and a paragraph of selected details. The sequence from general patterns to year-specific figures is broadly logical, and linking expressions such as “Overall,” “However,” and “also” help guide the reader. This coherent arrangement supports the explanation. Some connections, however, are unclear or do not express the intended comparison precisely. For example, “Once or twice a month also shows approximately similar trend over the year” does not specify what is similar, while “The year 2006 and 2013 have same proportion” is difficult to connect to the categories that follow. To strengthen progression, organise the overview around the main changes, then group the supporting figures by frequency category and use clear references to each year.
Lexical Resource: Band 6.0
You use an adequate range of task-related vocabulary, including “proportion,” “establishment,” “inhabitants,” and “categories,” and the meaning is generally understandable. There are also attempts at more formal phrasing, such as “a substantial amount” and “relatively lowest.” However, several choices are inaccurate or unnatural for describing chart data: people do not “choose to go” a particular number of times as naturally as they “eat out,” and “choice of food was ‘Fast Food’” misrepresents frequency as preference. “Relatively lowest” is also redundant, and “relitavely” contains a spelling error. Prefer precise collocations such as “the proportion of people who ate at fast-food restaurants” and “the lowest figure”; check spelling and avoid elaborate wording when a direct expression is clearer.
Grammatical Range and Accuracy: Band 6.0
You use a mix of simple and more complex forms, including the relative clause in “people who chose to go” and the comparison “more than in other years of comparison.” Most sentences remain understandable, but some grammatical errors and awkward constructions reduce precision. For example, “Once or twice a month also shows” lacks a clear subject reference, and “The year 2006 and 2013 have same proportion” has problems with number agreement and the article before “same proportion.” In “Every day eaters are relatively lowest,” the sentence structure is also awkward. Use plural agreement for two years (“The years … had”) and make the comparison’s subject explicit. More consistently accurate articles, agreement, and sentence construction would improve control while retaining your range of sentence forms.
See this exact question answered at other band scores. The same prompt compared across bands.
Browse more IELTS Writing model answers or get your own writing scored by the same AI examiner.